Sailing Topics
| Hurricane Irene - August, 2011 | |
| After a brief trip to
Chicago to take in a Cubs game with my brothers, I was ready
to get away from the dock and do some Chesapeake Bay cruising.
The first indication that my plans might be interupted was an
earthquake that shook the Washington, DC area on Tuesday, August
23, 2011 a few minutes
before my flight from Phildelphia to Baltimore touched down at
BWI. Clearly Mother Nature was going to screw with
my plans
once again. That earthquake didn't really affect my plans, but Hurricane Irene, which was passing over Puerto Rico at the time would. |
|
The 08/25/2011 1200z chart on the right shows Irene as it passes over the Abacos in The Bahamas. It was heading NNW, but predicted to turn more to the North and then NNE as it would brush by the Mid-Atlantic area before heading for New England. |
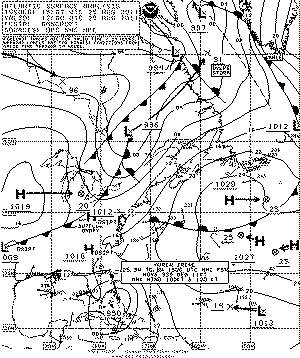 08252011 1200z NOAA Surface Analysis |
| That turn to the NNE is critical to the conditions we will
have on the middle Chesapeake Bay. If the storm stays off the
Delmarva coast we will get a lot of wind and an unusually high
tide (2'-3' above normal) Sunday, 8/28, morning, but no real
storm surge. However if the storm continues North or NNW
it could pull a surge of over 6' up into the Patuxent
River, where Sarah is berthed. The 1800z surface analysis shows Irene starting to turn more the to north, but still travelling west of due north. |
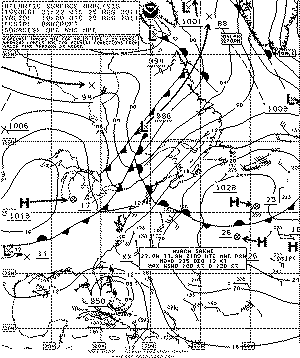 08/25/1800z NOAA Surface Analysis |
| By 0000z on the 26th, Irene was travelling almost due north. |
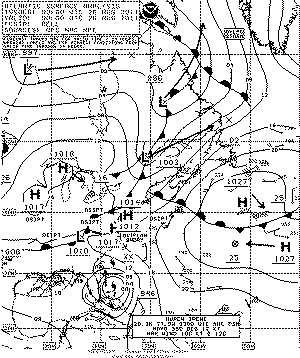 08/26/2011 0000z NOAA Surface Analysis |
| The 08/26 0000z 500mb analysis shows an upper level trough moving off the east coast. Hopefully that will provide a path for Irene to continue turn more to the East. |
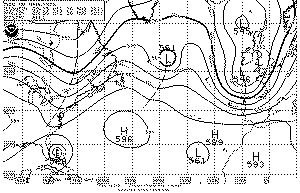 08/26/2011 0000z NOAA 500mb Analysis |
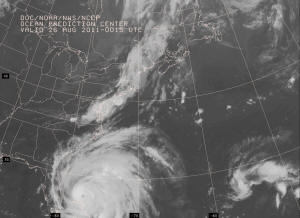
| The 08/26 0615z satellite image shows the size of this storm as it moves north of The Bahamas. |
 0826/2011 0615z NOAA Satellite Image |
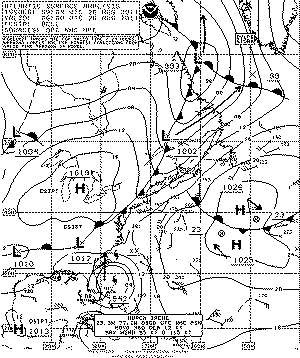
| At 0600z Irene appeared to still be moving due North as weak frontal system was moving toward the coast. |
 08/26/2011 0006z NOAA Surface Analysis |
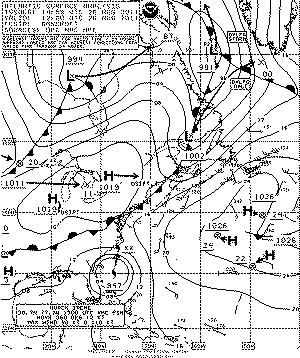
| The 1200z surface analysis shows the expected NNE course,
but that has not happened yet. Irene is still heading due
North at 12 kts. During this period Irene began show signs of weakening. |
 08/26/2011 12z NOAA Surface Analysis |
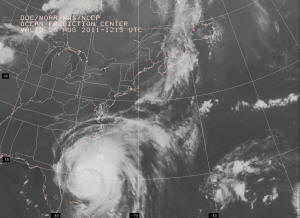
| The 1215z satellite image shows the size of this storm as it moves toward the Outer Banks. |
 08/26/2011 1215z NOAA Satellite Image |
| The 1800z surface analysis again shows the forecast NNE heading for the storm, but it was still moving due North. |
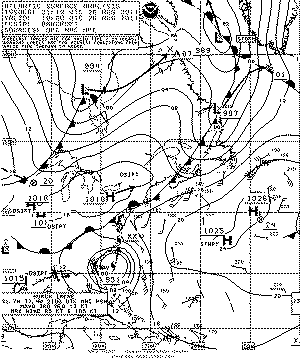 08/26/2011 18z NOAA Surface Analysis |
| Finally on the 08/27 0000z surface analysis Irene started moving just East of North. |
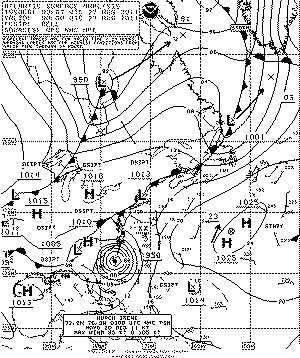 08/27/2011 00z NOAA Surface Analysis |
| Irene continued on this NNE on the 06z chart. |
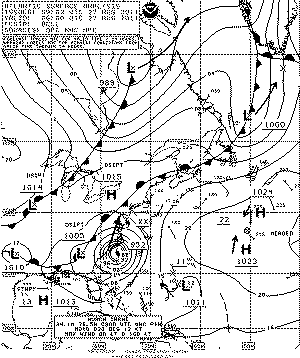 08/27/2011 06z NOAA Surface Analysis |
| By 1200z Irene was coming ashore at Pt. Lookout, NC |
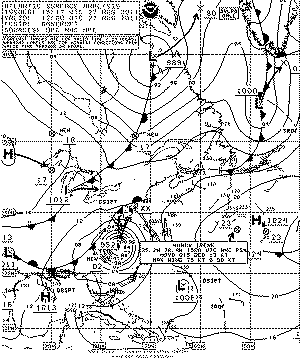 08/27/2011 12z NOAA Surface Analysis |
| Satellite image of Irene as it moved across the Outer Banks. |
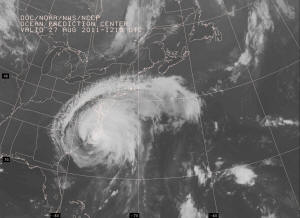 08/27/2011 1215z NOAA Satellite Image |
| By 0000z on the 28th the center of the storm was just East of the mouth of the Chesapeake. |
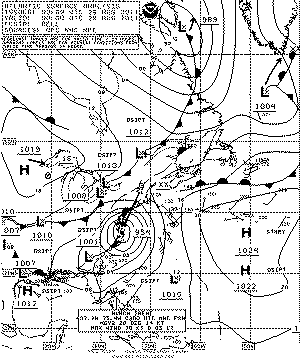 08/28/2011 00z NOAA Surface Analysis |
| By 0600z Irene was due East of Sarah's berth on the Patuxent River. |
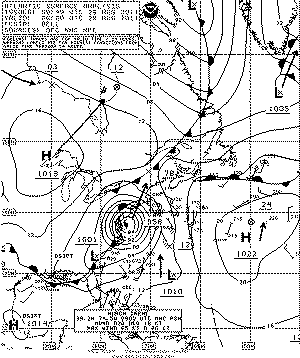 |
| By 1200z on the 28th Irene was North of the Chesapeake Bay, heading for New England. |
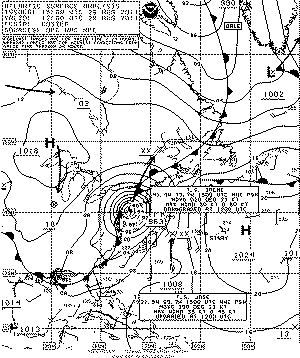 08/28/2011 06z NOAA Surface Analysis |
| I started a log of the position
reports for Irene on August 22 using my
OffShoreNavigationVBA
program. Starting on August 25 I started to record the
forecast positions as routes. This allowed me to plot
the observed and forecast positions of Irene as shown on the
right. In the graph on the right the program has plotted
all the observed positions for Irene that I recorded (yellow
dots). I also plotted the August 25 0000z forecast track
for Irene (blue line). I am very impressed with accuracy
of the forecasts NOAA made on this storm. The storm moved
a little further north before re-curving to the NE than
forecast, but they got the western most longitude of the track
almost exactly right. This is a major improvement in
tropical storm forecasts over those that were made back in the
60s when I was a USAF weather forecaster. The graph shown is a basic x-y plot of latitude and longitude generated by MS Excel. This is not a map projection. |
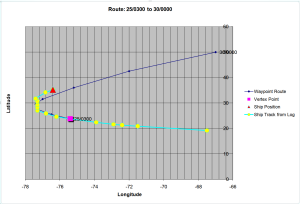 Track and Forecast Plot of Hurricane Irene |
| Securing Sarah | |
|
The only canvas I removed from on deck was the Bimini. I wrapped the mizzen and mainsail with rope. I also wrapped the staysail in rope. The dinghy is tied down on the forward portion of the trunk cabin. The furled Genoa is secured with a 1/2" machine screw to keep the furling drum from moving. This should be more than sufficient preparation as long as the sustained winds do not exceed 80 kts. |
|
|
In addition to the stern lines I rigged a midship line on the starboard side to hold Sarah off the finger pier. |
|
|
The lines are holding Sarah about 2' off the finger pier. As the water rises, the starboard stern and mid-ship lines should pull Sarah further off the pier. I believe I have rigged Sarah to safely ride a rise in the water level above the normal tides in excess of 4'. Another 24 hours will determine if I am correct. |
|
After securing Sarah I moved into a local hotel. I hoped
the hotel would have more reliable power than the area where
Sarah was berthed. I would have both cable TV and
high-speed Internet access providing up-to-date information on
the storm.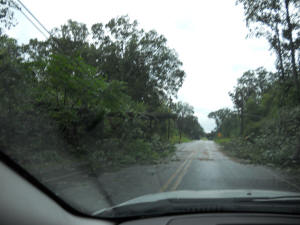 Well
the hotel power went out early that evening so no TV or
Internet. At least the hotel wasn't rocking like I'm sure
Sarah was doing. I got a decent nights sleep, then checked
out the next morning after the storm had passed. Well
the hotel power went out early that evening so no TV or
Internet. At least the hotel wasn't rocking like I'm sure
Sarah was doing. I got a decent nights sleep, then checked
out the next morning after the storm had passed.As I drove to the dock from the hotel I saw many trees down on power and telephone lines. In the picture on the right a tree has fallen on power lines, but lines did not break. Local neighbors or County crews had already cut the top of the tree to allow cars to get by in one lane. One of the roads I normally take to the dock was completely blocked by a downed tree. Serveral of the power poles where broken by falling trees. It didn't look I would be seeing power at the dock for several days. |
|
|
|
|
|
|
|
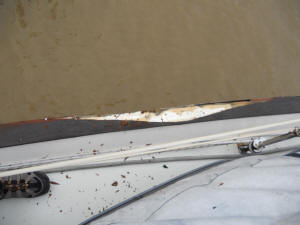 The
same rub rail near the bow did not fair so well. The rub
rail must have gotten on top of the piling near the bow and
ripped the wood cap rail nearly off the boat. Fortunately
the broken piece was still attached to Sarah and I could remove
it for late repairs. The
same rub rail near the bow did not fair so well. The rub
rail must have gotten on top of the piling near the bow and
ripped the wood cap rail nearly off the boat. Fortunately
the broken piece was still attached to Sarah and I could remove
it for late repairs. |
|
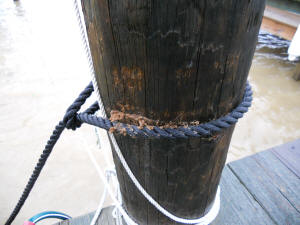 This is the starboard stern line, one of two lines I hoped would hold
Sarah off the pilings. You can see how the rope dug into
the piling during the height of the storm. I did not fully
account for the amount this line, and the other, would stretch
during the peak winds, which probably exceeded 60 kts.
This is the starboard stern line, one of two lines I hoped would hold
Sarah off the pilings. You can see how the rope dug into
the piling during the height of the storm. I did not fully
account for the amount this line, and the other, would stretch
during the peak winds, which probably exceeded 60 kts.The problem I had rigging Sarah for the storm was that the berth is really for a much smaller boat. I attempted to keep Sarah centered in the slip, but I should have just rigged her for the expected NE Hurricane-force winds and not worried about the SW winds after Irene moved to the north. Also the lack of a real surge meant the slack I left in the lines of negative value and allowed Sarah to lay up against the leeward pilings. If I had shortened the starboard stern and mid-ship lines another foot or so I don't believe Sarah would have been damaged by the storm. |
|
 I
lived on Sarah for two days, running the generator twice a day,
before shore power was restored on August 30, 2011. I
lived on Sarah for two days, running the generator twice a day,
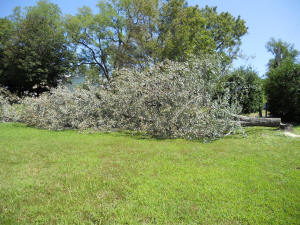
before shore power was restored on August 30, 2011.Just before the power was turned back on, the power company cut down this tree on the dock property. They obviously felt it was in danger of falling on the power lines in another storm. So now, as of August 30, the storm is in the North Atlantic and I have several new repair projects on Sarah. |
|
| Weather Data Recorded at Solomons, MD | |
 NOAA Tides & Currents Website |
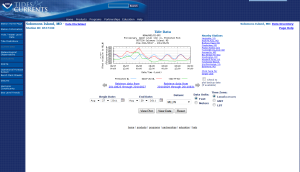
On the left is a screen capture (click on image to view it at full resolution) of the tidal data recorded by NOAA at the Solomons weather station. This shows a peak surge above normal tides of about 2.5 feet around 09:30 PM EDT on the 27th. This agrees with the evidence at the dock shown above. |
|
On the right is a screen capture of the weather data recorded by
the NOAA weather station at Solomons (click on the image to view
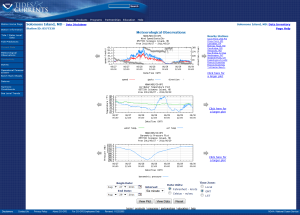
at full resolution). The wind speed and direction graph at the top shows that the maximum wind gusts during the storm passage were barely over 60kts. The sustained winds peaked at about 40 kts and stayed above 30 kts for about 9 hours. The minimum pressure of about 980mb ocurred around 1:30 AM EDT on the 28th. It is really hard to believe that these less than Hurricane-force winds and the moderate surge caused all of the damage and power outages in this area. We received equally strong winds during thunderstorms this summer, although winds lasted less than an hour rather than 9 hours. |
 NOAA Tides & Currents Website |
 Solomons Weather and Tide Station (NOAA Photo) |
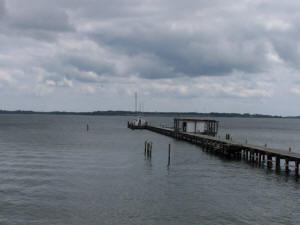
In case you were thinking the recording station for this data might be protected from Irene's force, the photo on the left shows the station. It is located at the end of long pier (300', maybe) in the Patuxent River. This pier is part of the University of Maryland Estuaries Research Facility in Solomons. |