Sailing Topics
| Hurricane Sandy 2012 |
|
| Toward the end of October, 2012 a Tropical Storm began to
form in the Carribbean south of Jamaica. This not the
normal location for the formation of a storm that will strike
the US East Coast, but I started to monitor the reports and
analysis from the National Hurricane Center (NHC).
Eventually this storm became Hurricane Sandy just before it
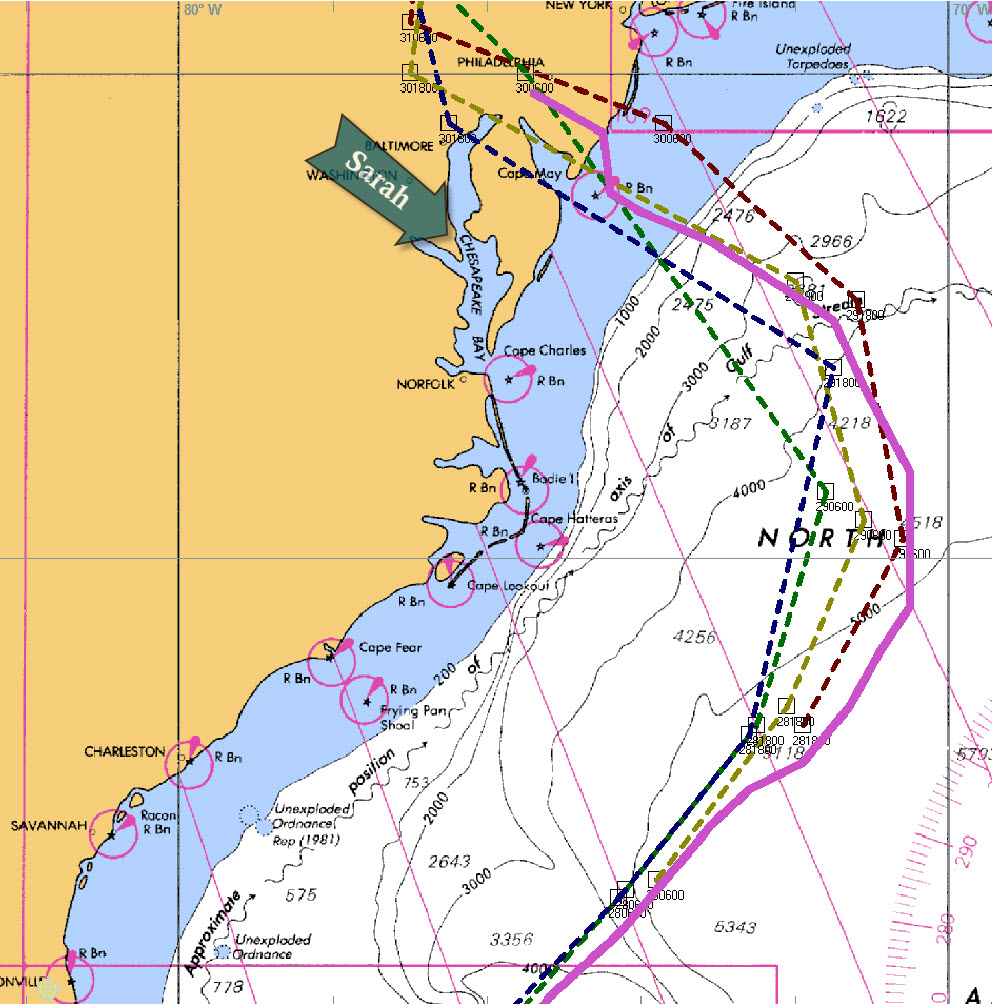
moved across Jamaica and Cuba, heading north. This had been a virtually storm-free summer on the East Coast. The only storm to strike the US was Isaac, which came ashore near New Orleans. I wasn't very concerned about Sandy as it appeared to be on a typical track to stay off the East Coast then head NE to Northern Europe as an early winter storm. Then the NOAA forecasts showed the storm veering to west and striking Mid-Atlantic coast. At the time Sarah was berthed at a friend's dock off the Patuxent River in Maryland (arrow on the chart on the right). If the storm moved as predicted it would come very close to that location. |
 Oct 27, 2012 0000Z Sfc Analysis Courtesy of NOAA |
 Oct 27, 2012 1200Z Sfc Analysis Courtesy of NOAA |
12 hours later Sandy was moving NE at less than 10 kts as a Category 1 Hurricane. The storm was expected to continue on a N-NE course for the next 48 hours until it interacted with the frontal system and low pressure trough moving toward the coast. Then Sandy was expected to veer quickly to the WNW and move inland near the mouth of the Delaware Bay. |
| I elected to stay on board at least through Sunday night.
If things got dicey I could move to a hotel or stay with
friends. The 0600Z chart on the 28th showed Sandy still
moving the NE at about 10 kts. It was still forecast to
veer to the west when it interacts with the frontal system
approaching the coast. On Oct 28 the forecast for Sandy's
landfall had been moved further north from Delaware Bay to the
middle of New Jersey. Because Sandy was such a big storm that change would not have much impact on the weather conditions here in southern Maryland. |
 Oct 28, 2012 0600z Sfc Analysis Courtesy of NOAA |
 Oct 28 1500z Track and Forecast |
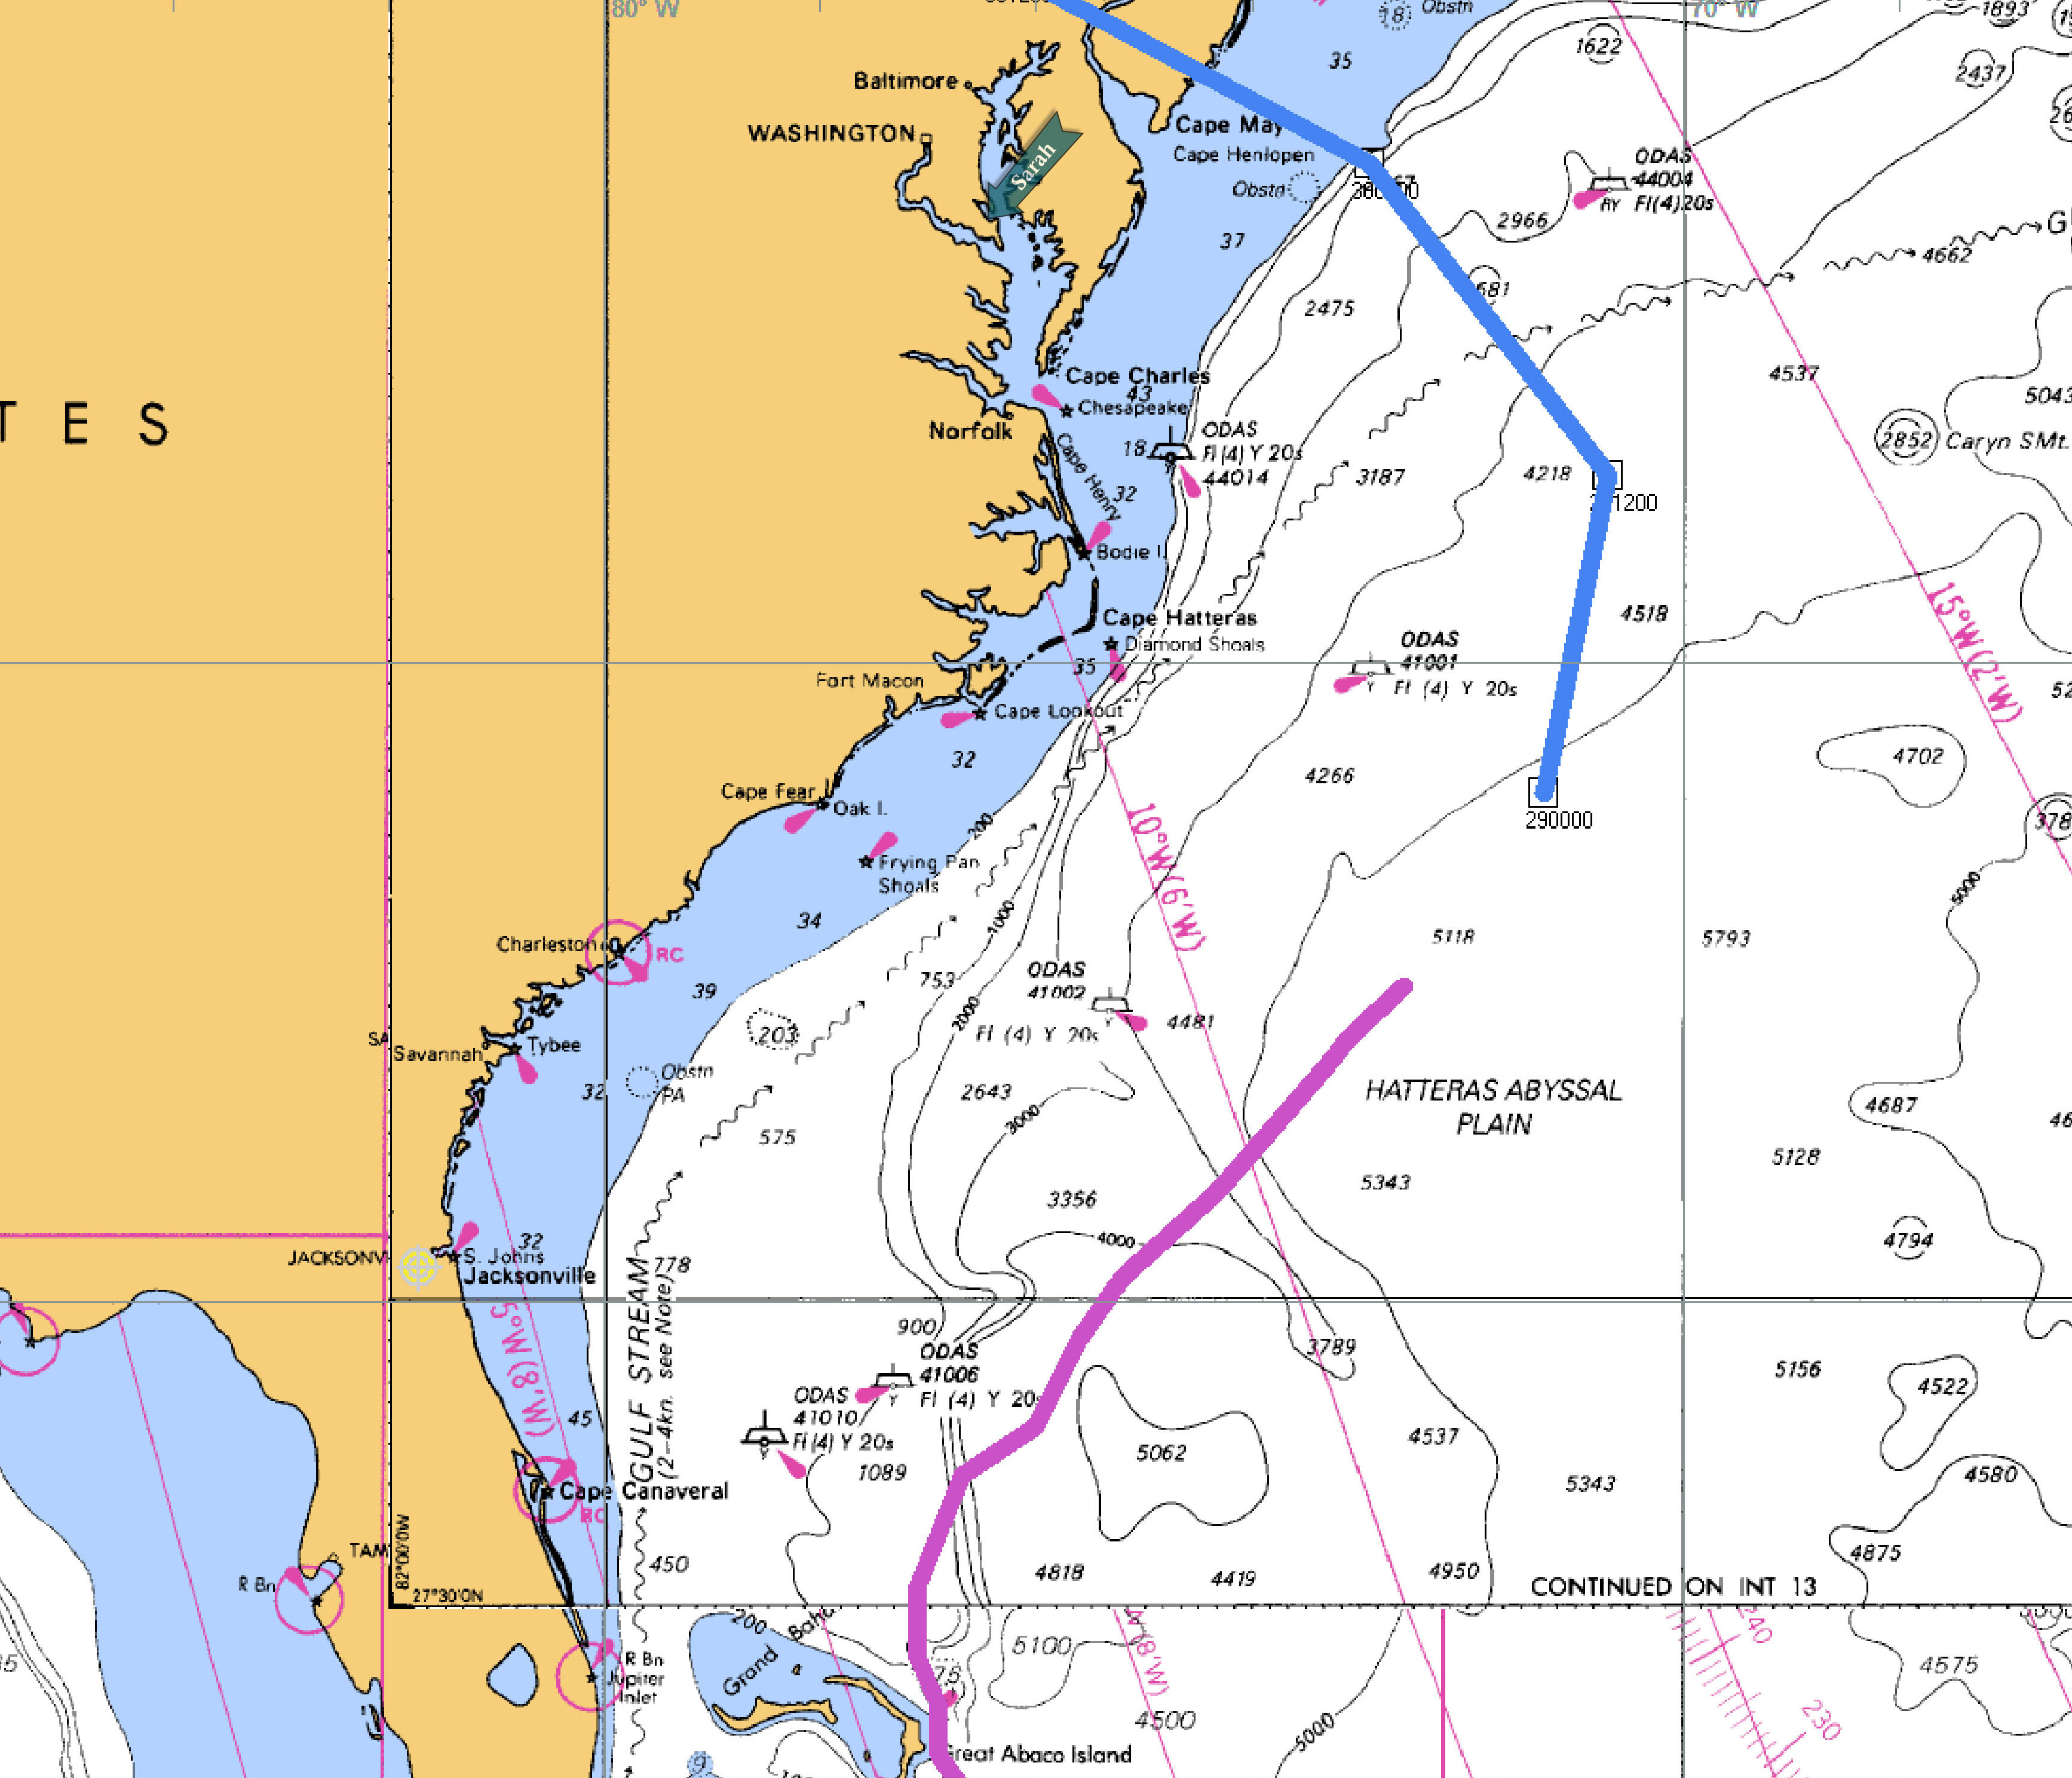
On the left I plotted the track of Sandy (magenta line) and its forecast path (blue line) on a chart of the US East Coast using OpenCPN. This data was as of 1500Z on Oct 28. |
| By 0600z on the 29th Sandy had begun moving north and was forecast to start heading NW within the next 6 hours. The forecast track still brought Sandy ashore in southern NJ, but given the size of this storm that is a little too close for comfort. I elected to spend the night of the 29th with friends in Washington, DC. |
 Oct 29, 2012 0600z Sfc Analysis Courtesy of NOAA |
 Oct 29 1200z Track and Forecast |
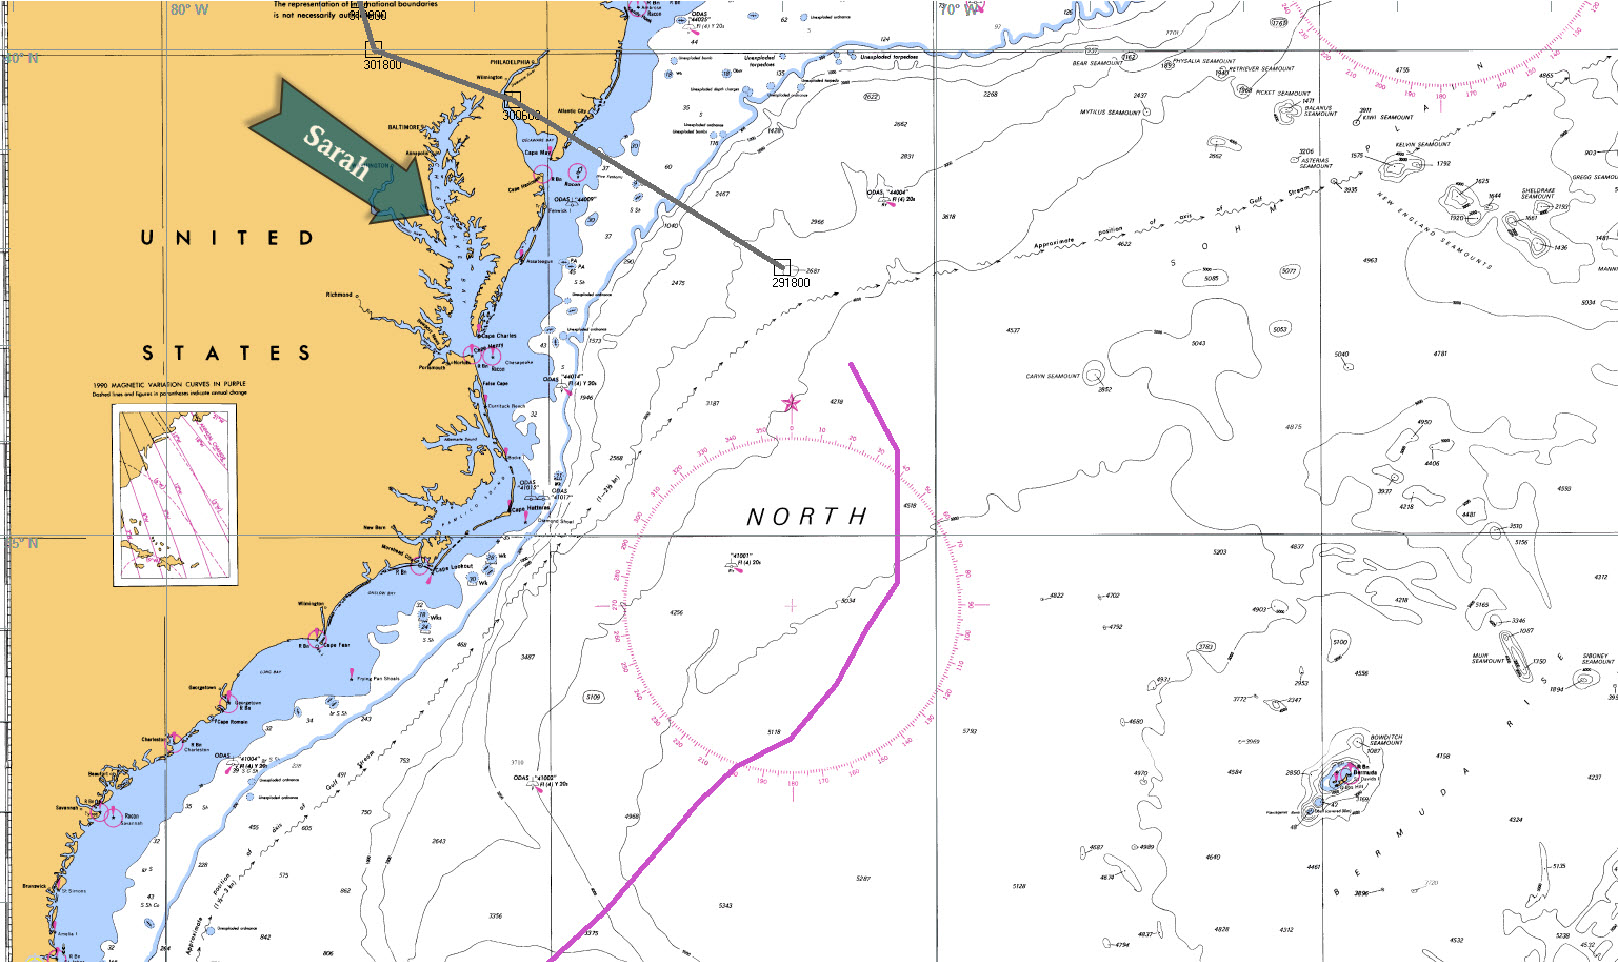
With the 1200z position report the the track (magenta line) clearly shows Sandy is moving to the NW as forecast. |
| Sandy came ashore near Atlantic City, NJ on the evening of
Oct 29. The Oct 30 0300z chart on the right shows Sandy
well inland over eastern Pennsylvania. Although Sandy was barely a Category 1 Hurricane when it approached the coast and transformed itself into an Extra-Tropical Storm before it came ashore, this will likely go down as one of the most destructive storms to ever strike the US. That is primarily due to the huge storm surge it sent into the most populous coastal region in the country - New Jersey and New York. |
 Oct 30, 2012 03z Sfc Analysis Courtesy of NOAA |
 Oct 30 0300z Track and Recent Forecasts |
On the left is the final track (magenta line) of Sandy.
I have also plotted the most recent NOAA forecasts (dashed
lines) issued prior to the storm turning to the Northwest. According to the NOAA discussions published on this storm as it advanced up from the Carribbean, these forecast tracks were largely produced by the GFS and ECMWF computer models. I am truly amazed at the sophistication of these models (and the meteorologists) to accurately predict such an unusual storm track. A lot different from when I was a forecaster back in the 60s. |
| The closest weather reporting
station to Sarah's berth is the Solomons, MD station. I
captured the winds, pressure and sea state from that site on my
page on Hurricane Irene in
2011. Unfortunately the station appears to be having
problems and no longer reports wind and pressure and its
reporting is erratic. Instead I have captured the wind and pressure data from the station on the Cove Pt. Liquid Natural Gas Terminal pier. The strongest winds were likely prior to the data on the chart. I've added a green dashed line to show the approximate time Sandy passed due north of the terminal. The wind data shows the wind direction changing from WNW prior to that time to SW afterward. |
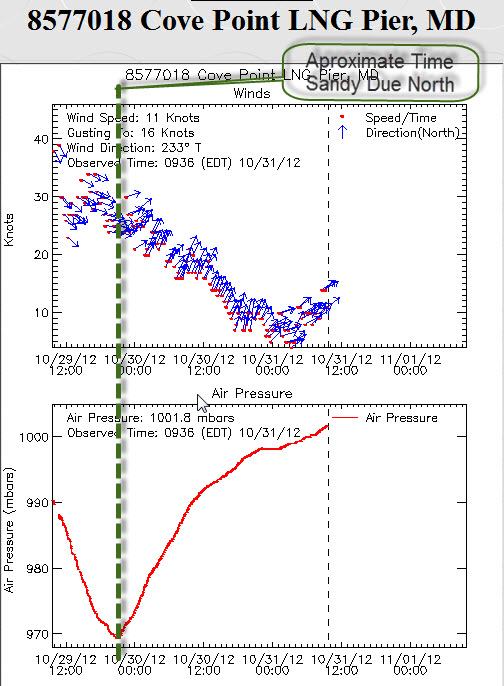 Cove Pt. Winds and Air Pressure Courtesy of NOAA |
| Preparing Sarah For the Storm | |
| I had spent most of the summer of 2012 berthed in Cuckold
Creek, off the Patuxent River, thanks to the hospitality of
friends. This is the same berth at which Sarah rode out Hurricane Irene in 2011. That storm caused a good deal of cosmetic damage to Sarah's cap rail. The slip is not really large enough for a 42' sailboat. |
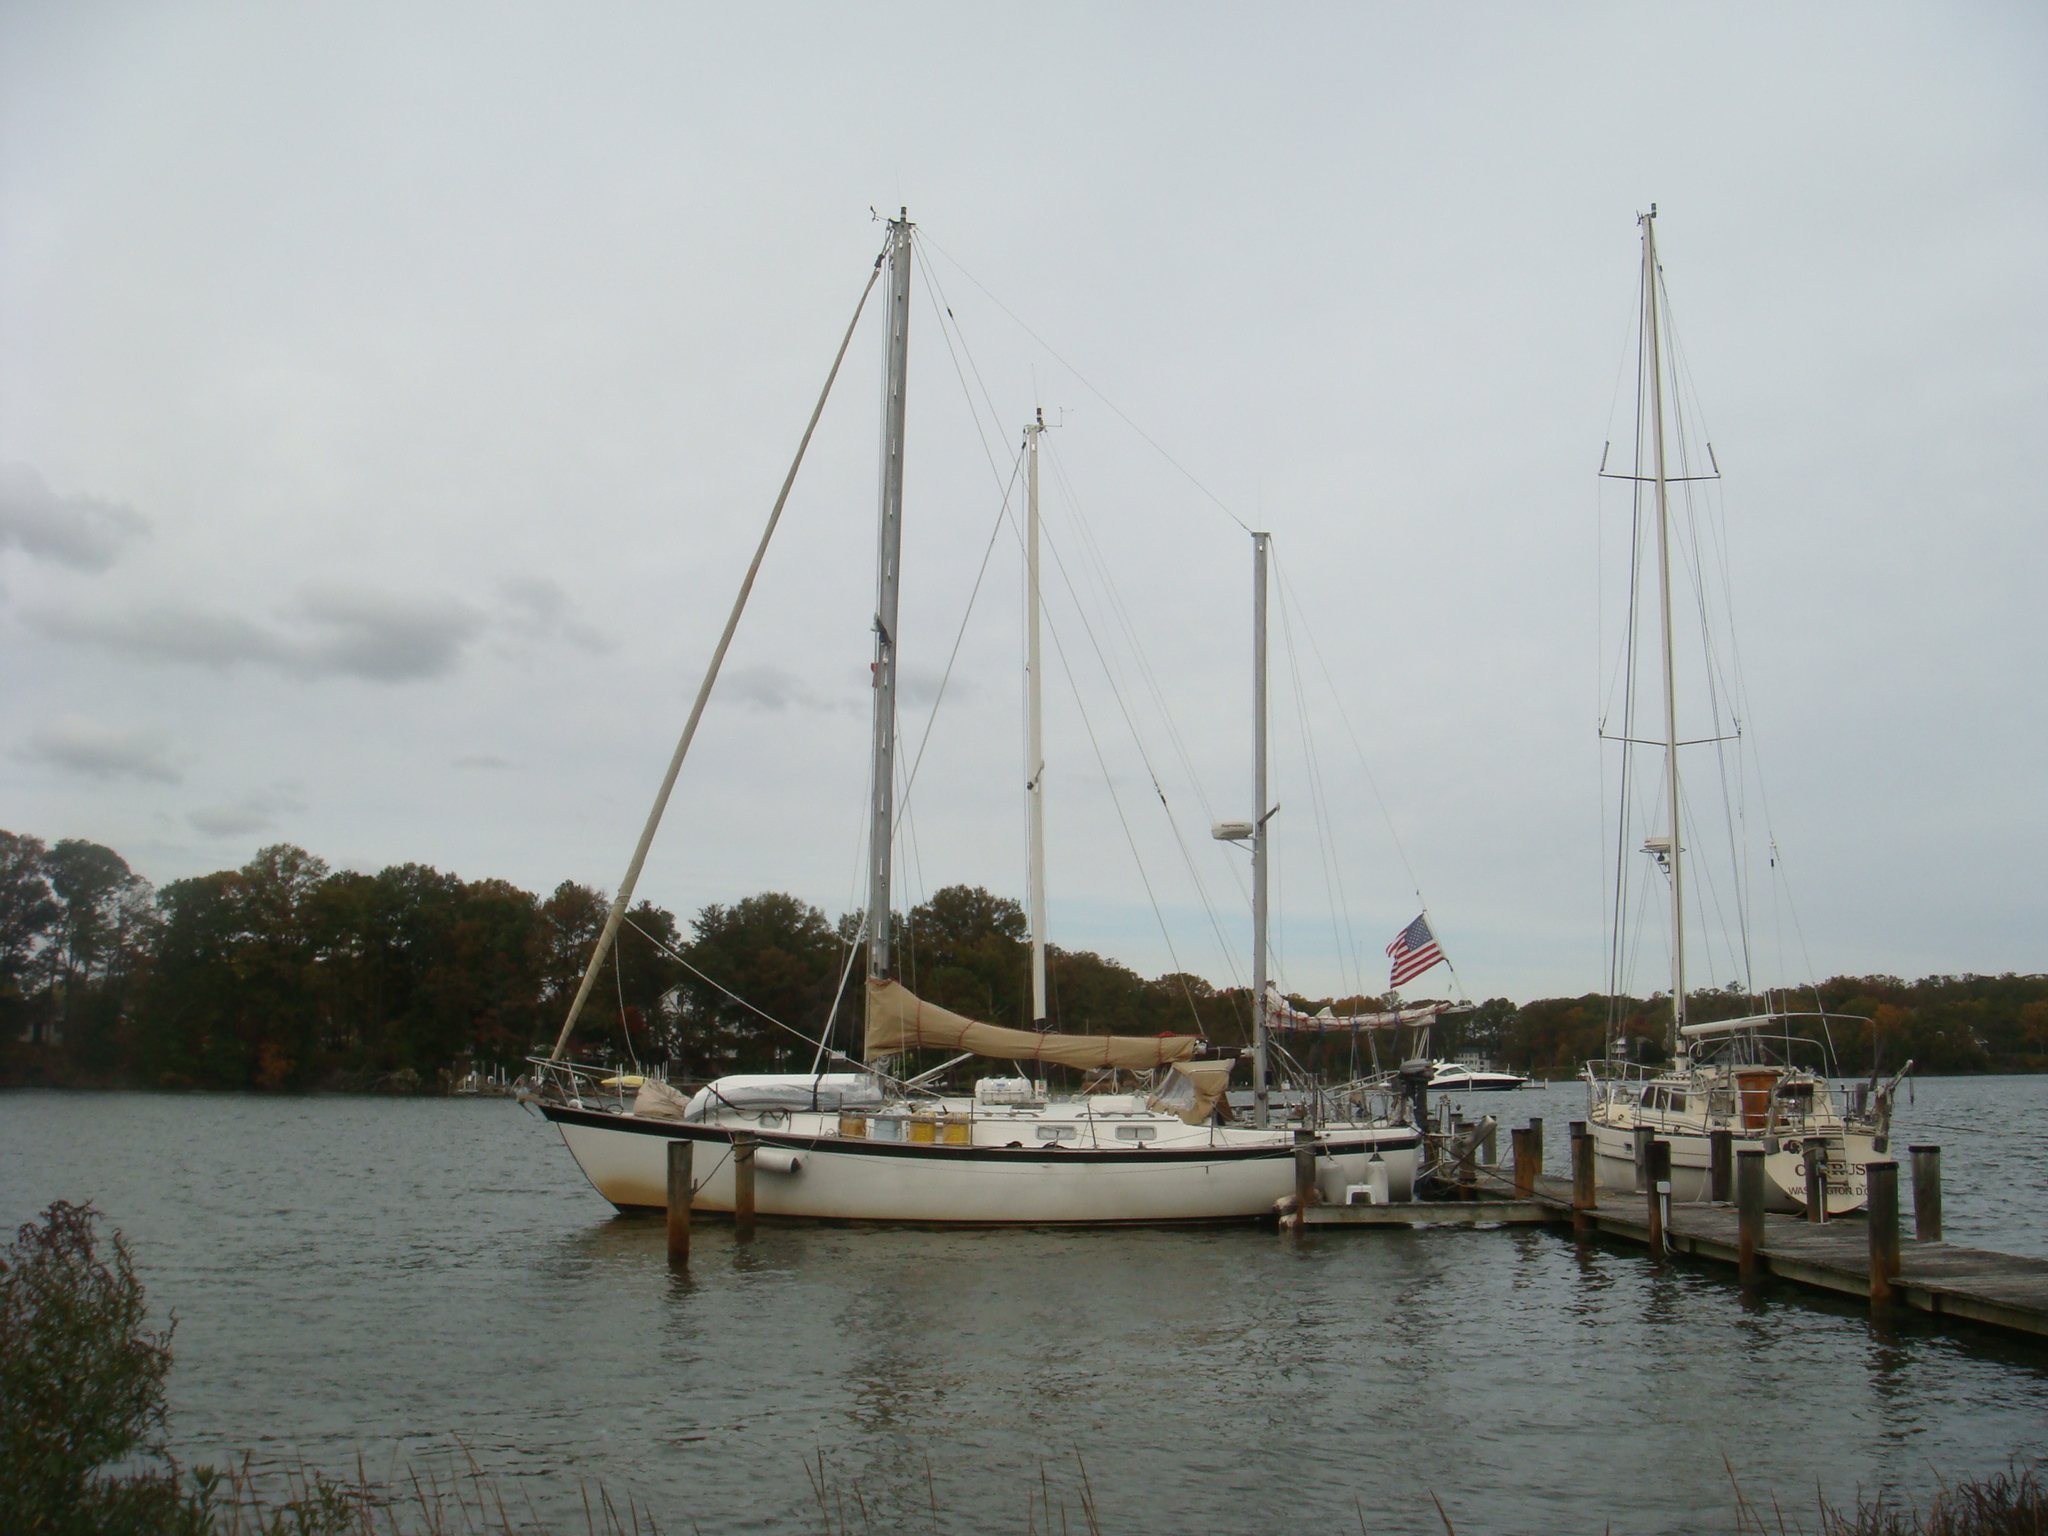 Sarah Berthed in Cuckold Creek off the Patuxent River |
 Tight Quarters for Sarah |
At first I considered riding out the storm at anchor.
Cuckold Creek offers several very good anchorages that would
provide good protection, especially from a north wind.
I stuck with that plan until Oct 27. By then the NOAA forecast for a Mid-Atlantic coast landfall had not changed much for several days. The close proximity of the storm track to Sarah's location meant I would have to find protection from not only north winds, but northwest winds, west winds and southwest winds - all of gale force or higher. Anchoring for the storm began to seem not such a good idea. |
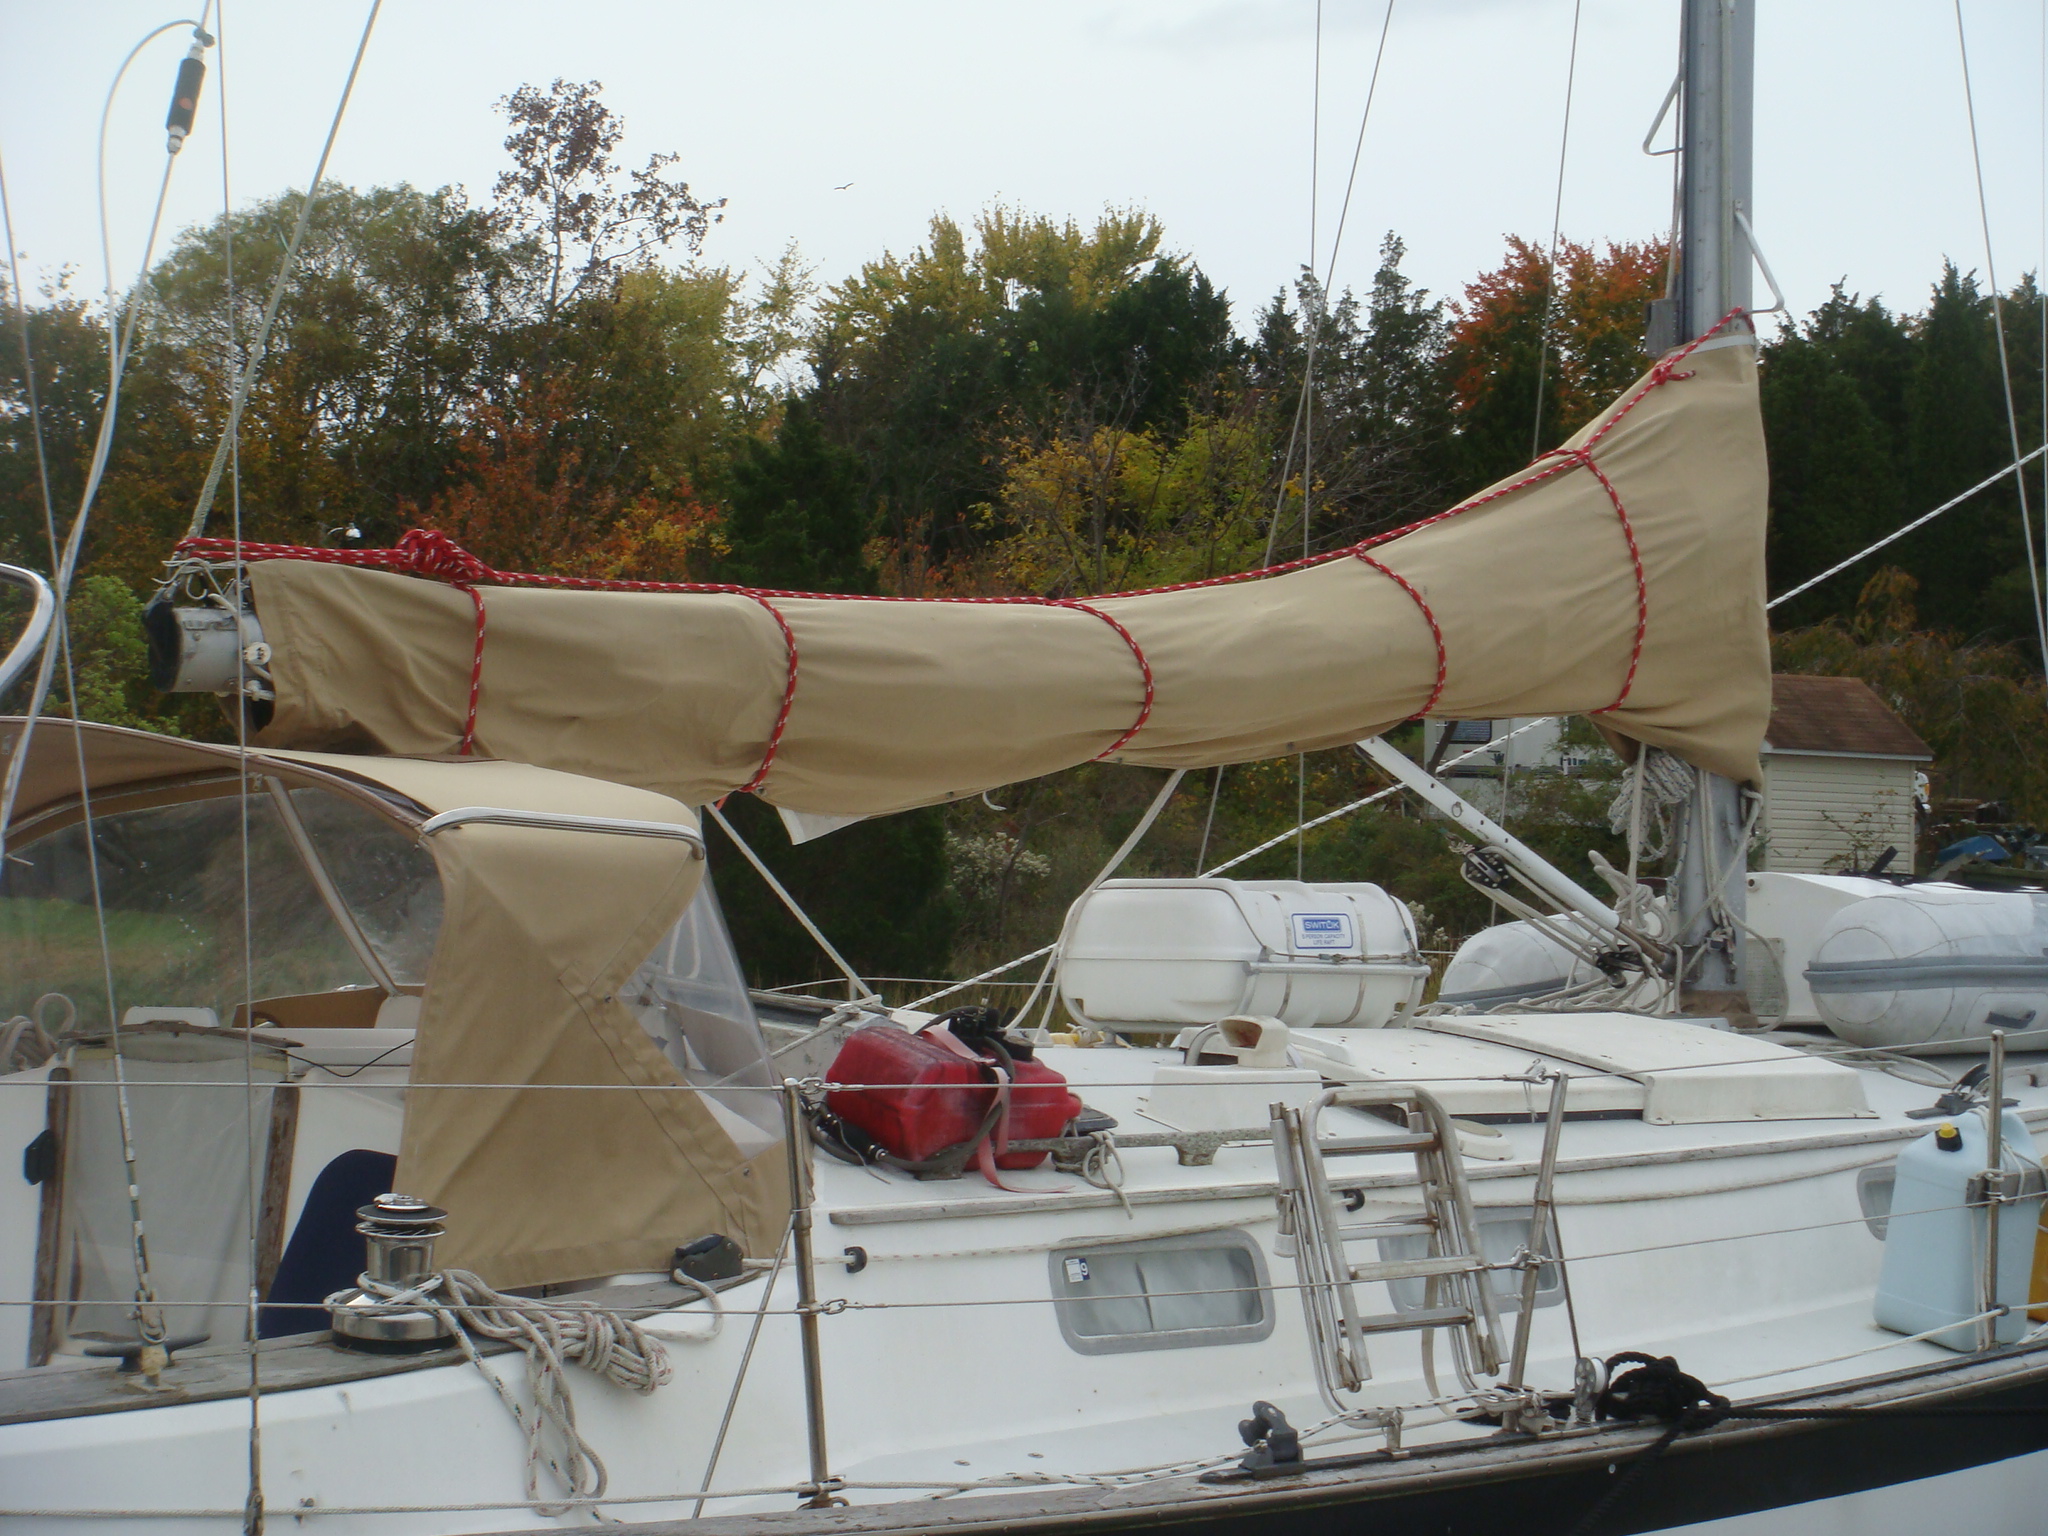
| So I decided to keep Sarah in the berth and try to make her
a little more secure than I did for Hurricane Irene. After tieing down the main sail (shown on the right) and mizzen sail I secured the furled genoa with a 3/8" bolt through the drum and housing. If I thought we really had a threat of Hurricane force (75 kts) winds in Cuckold Creek I would have removed all of the sails and the Dodger. I expect to see only gusts above 50 kts. |
 Securing Sarah for the Storm |
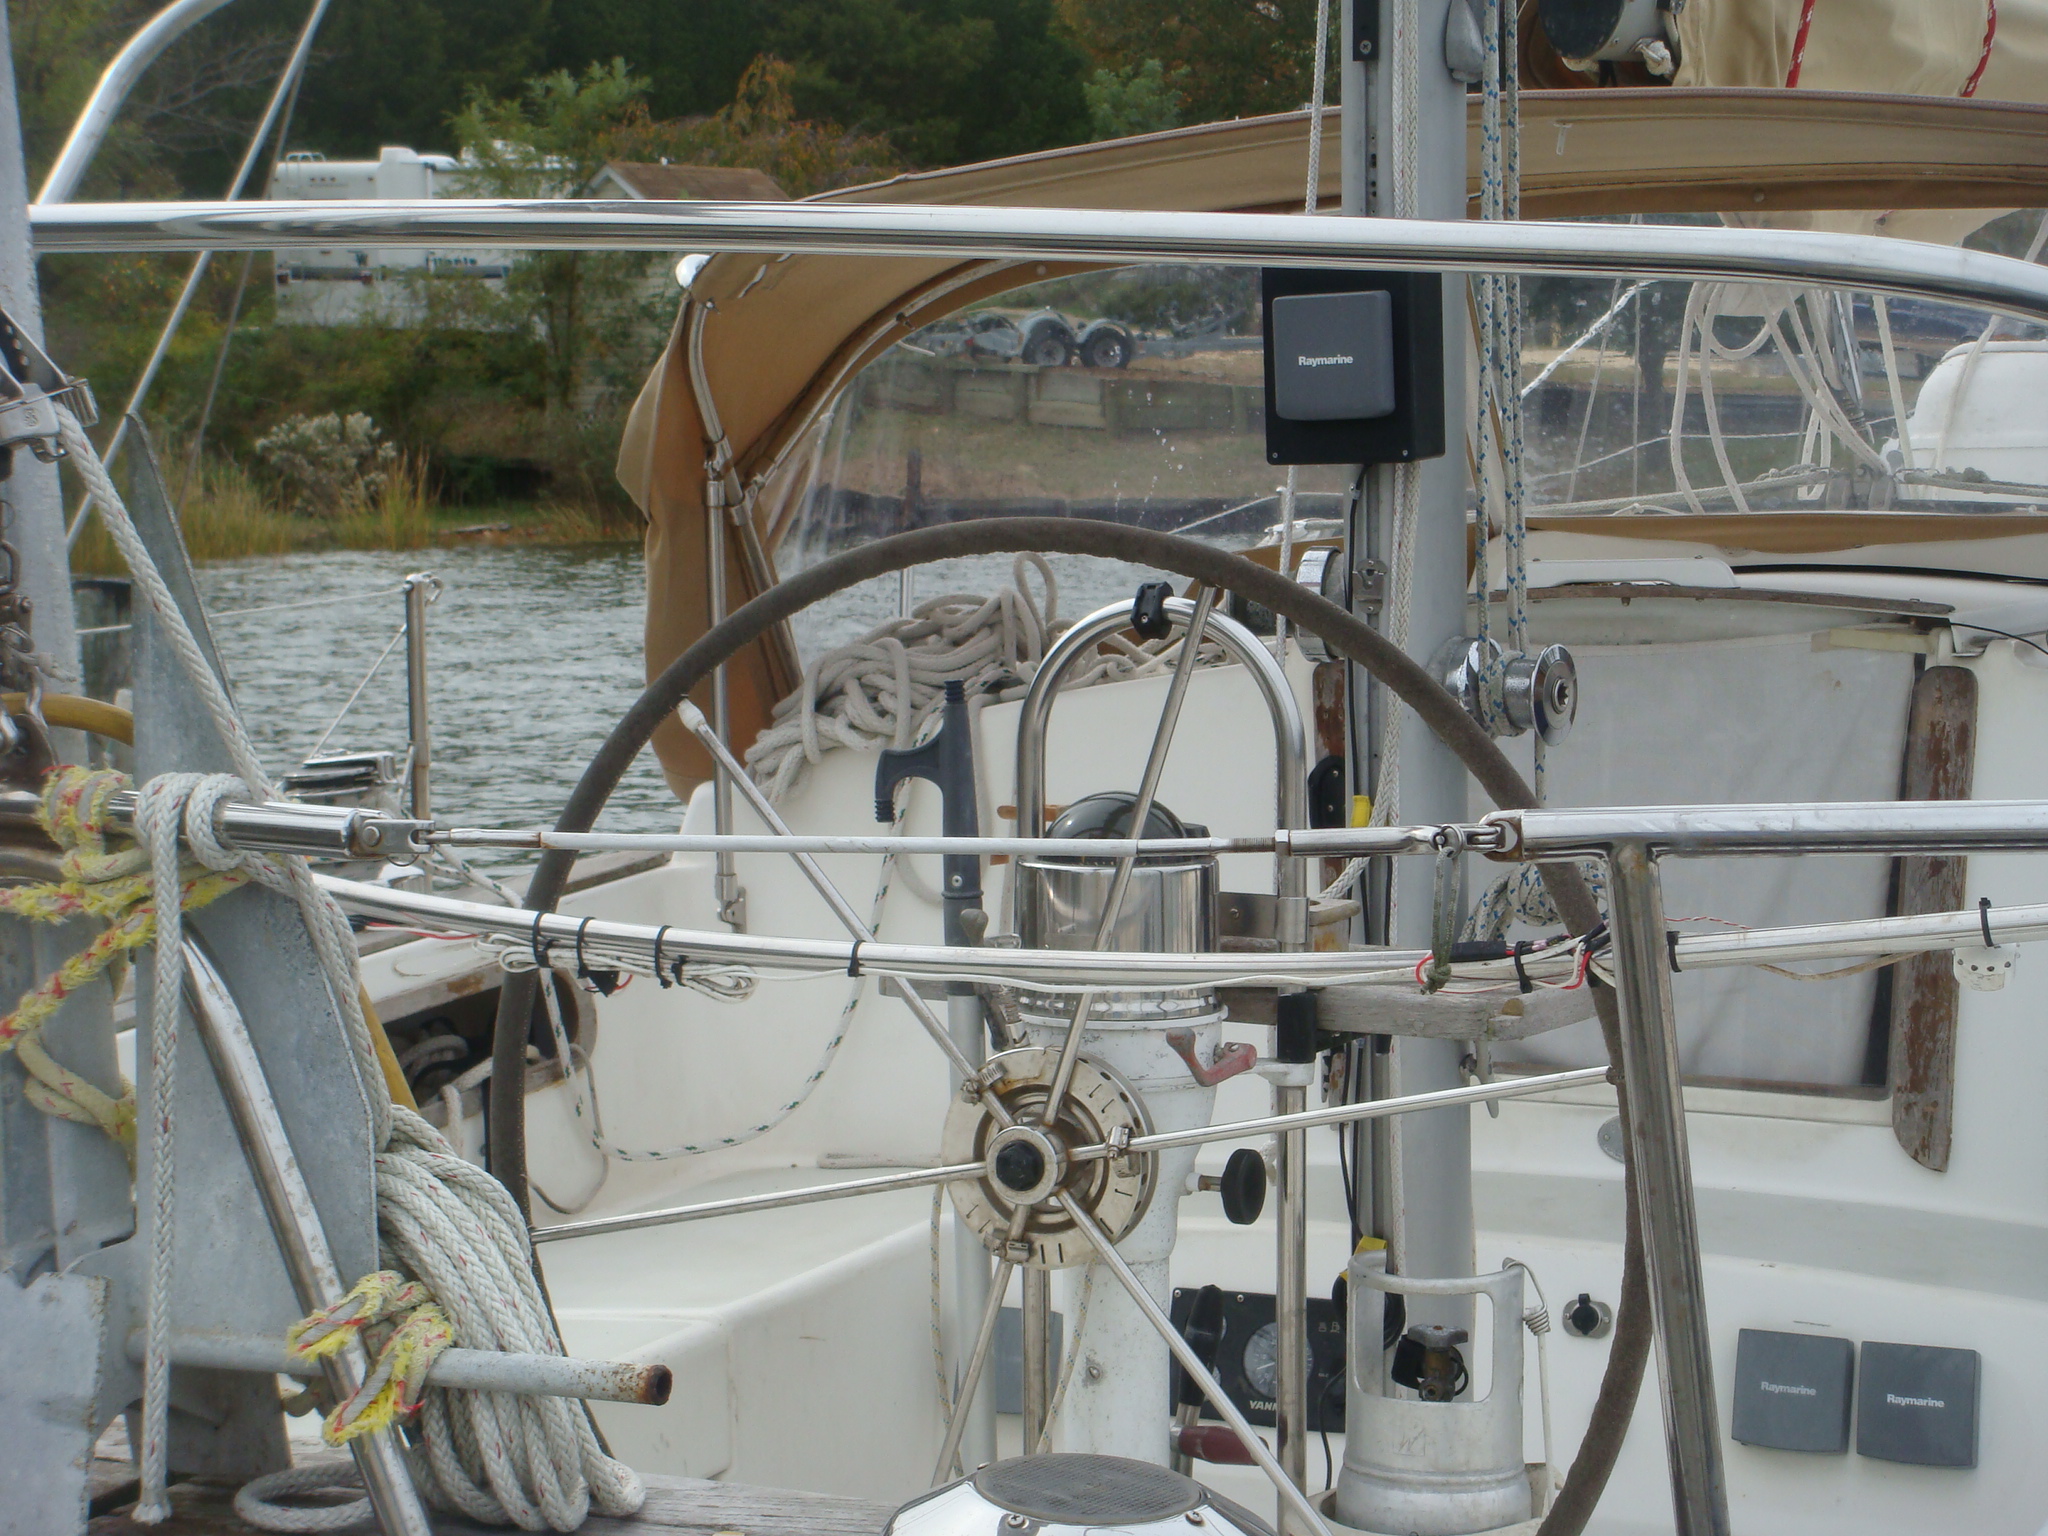 Sarah's Cockpit Prepped for the the Storm |
I did remove the Bimini, cockpit
cushions and anything else that might get blown around. Now I have a couple of days to wait and see if my preparations were sufficient. |
| After the Storm | |
| After spending the night Sandy came ashore with friends in DC, I returned to Sarah the next day to move back on board. I arrived a few hours before high tide and was surprised to see the water level well above the dock. This is nearly 3' above the normal water level. |
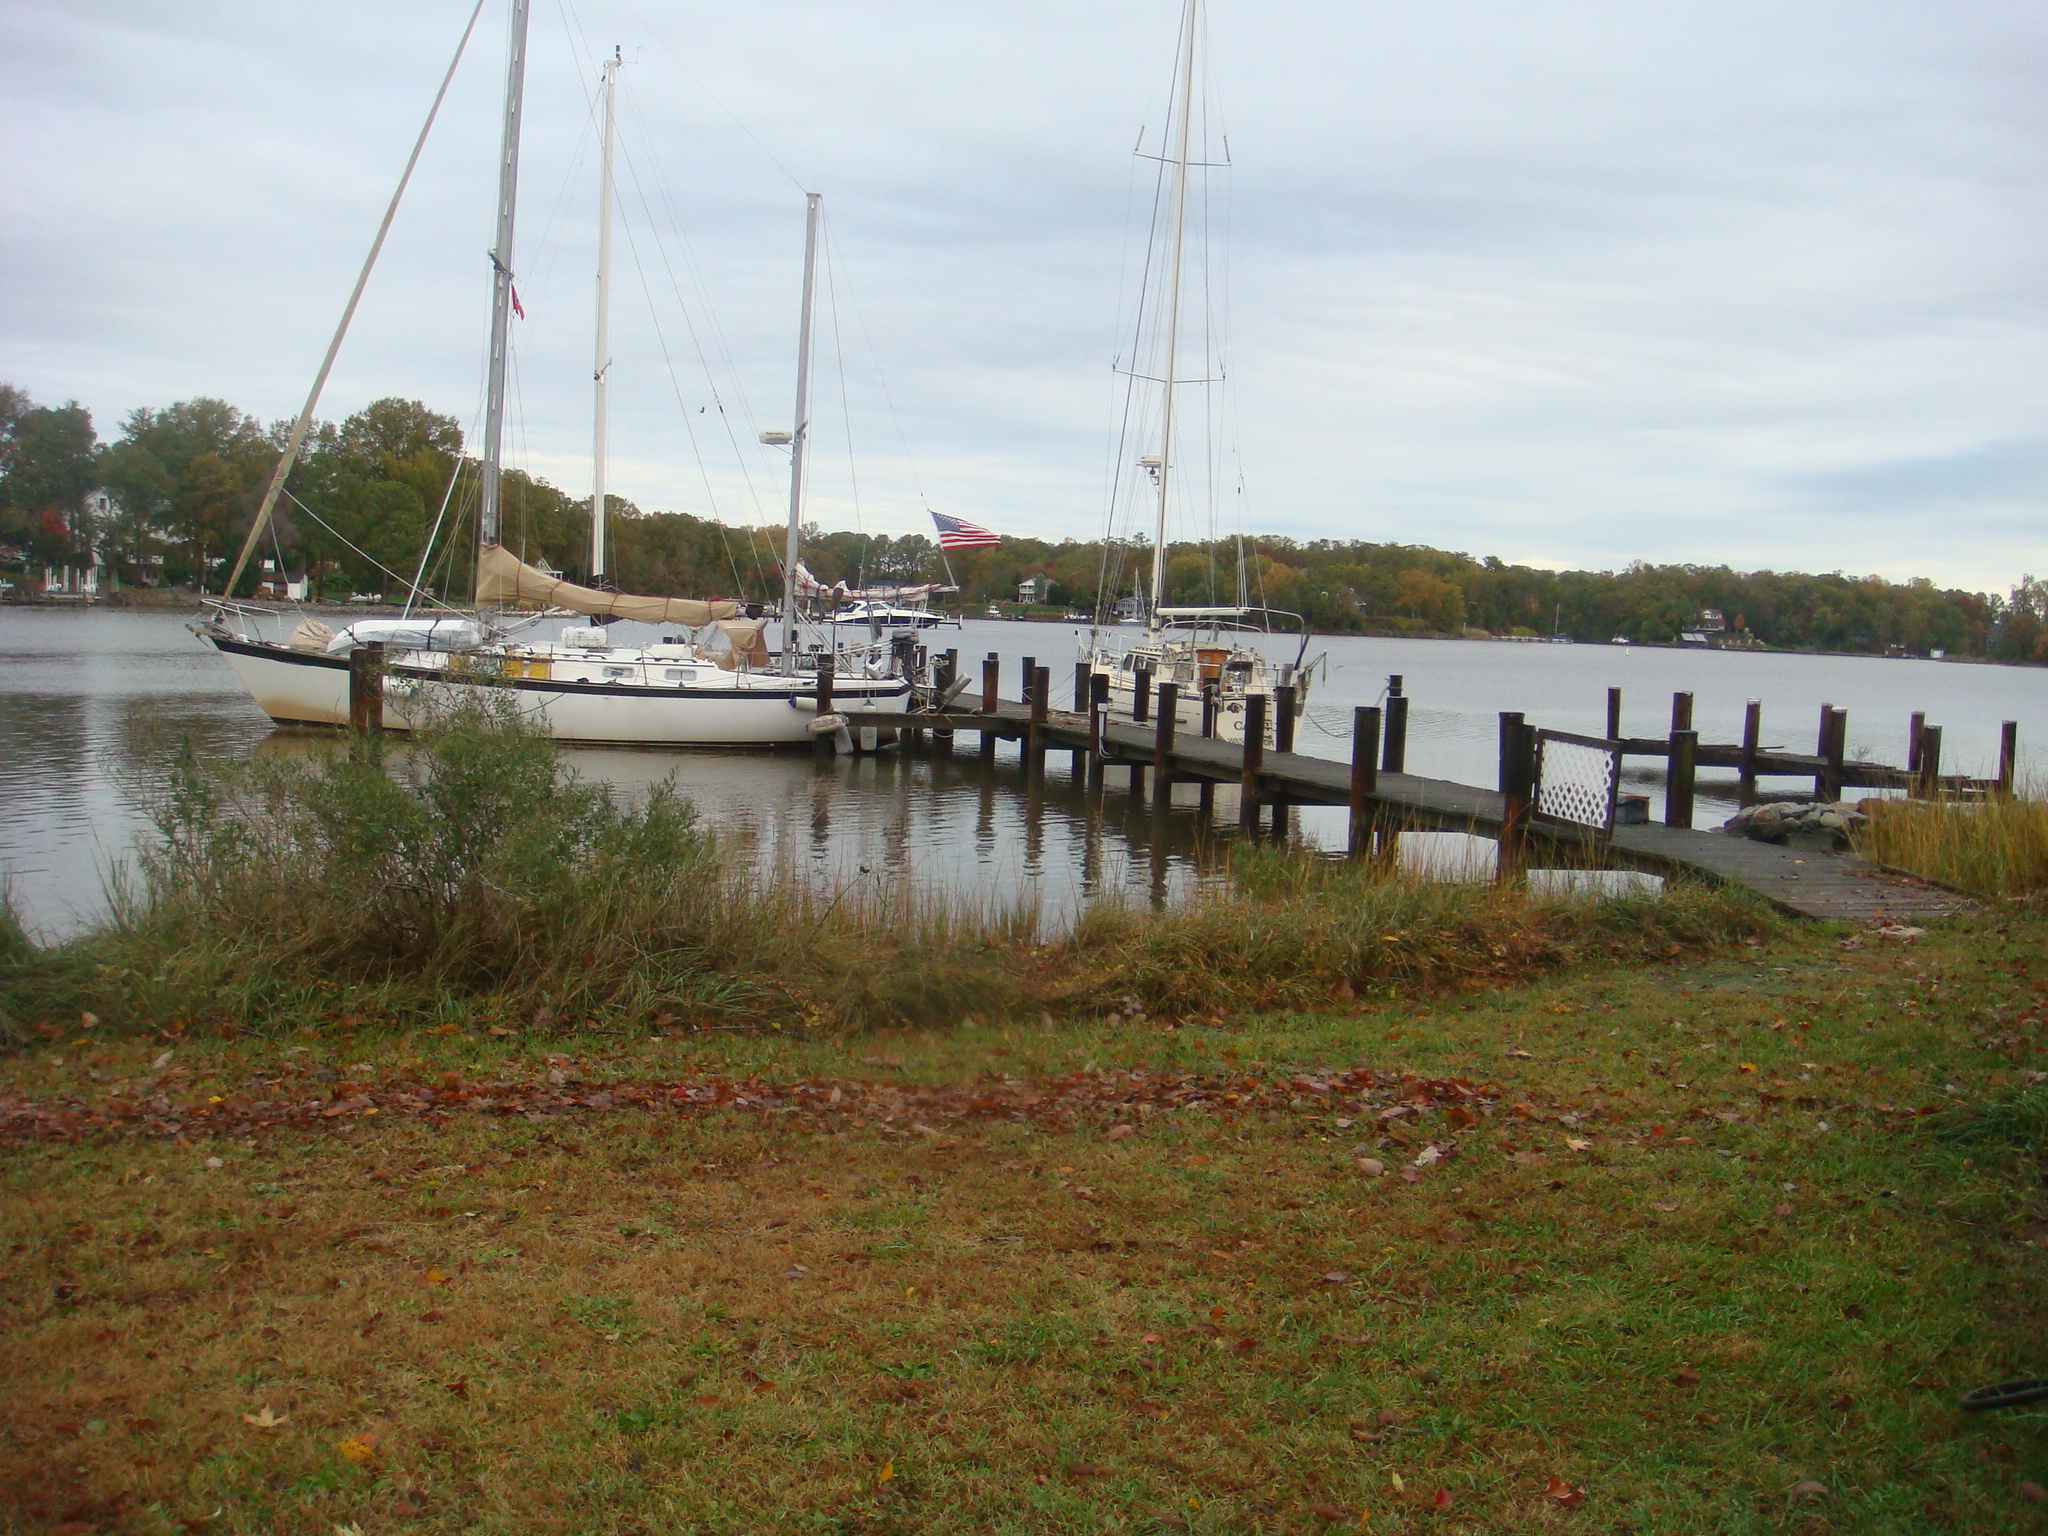
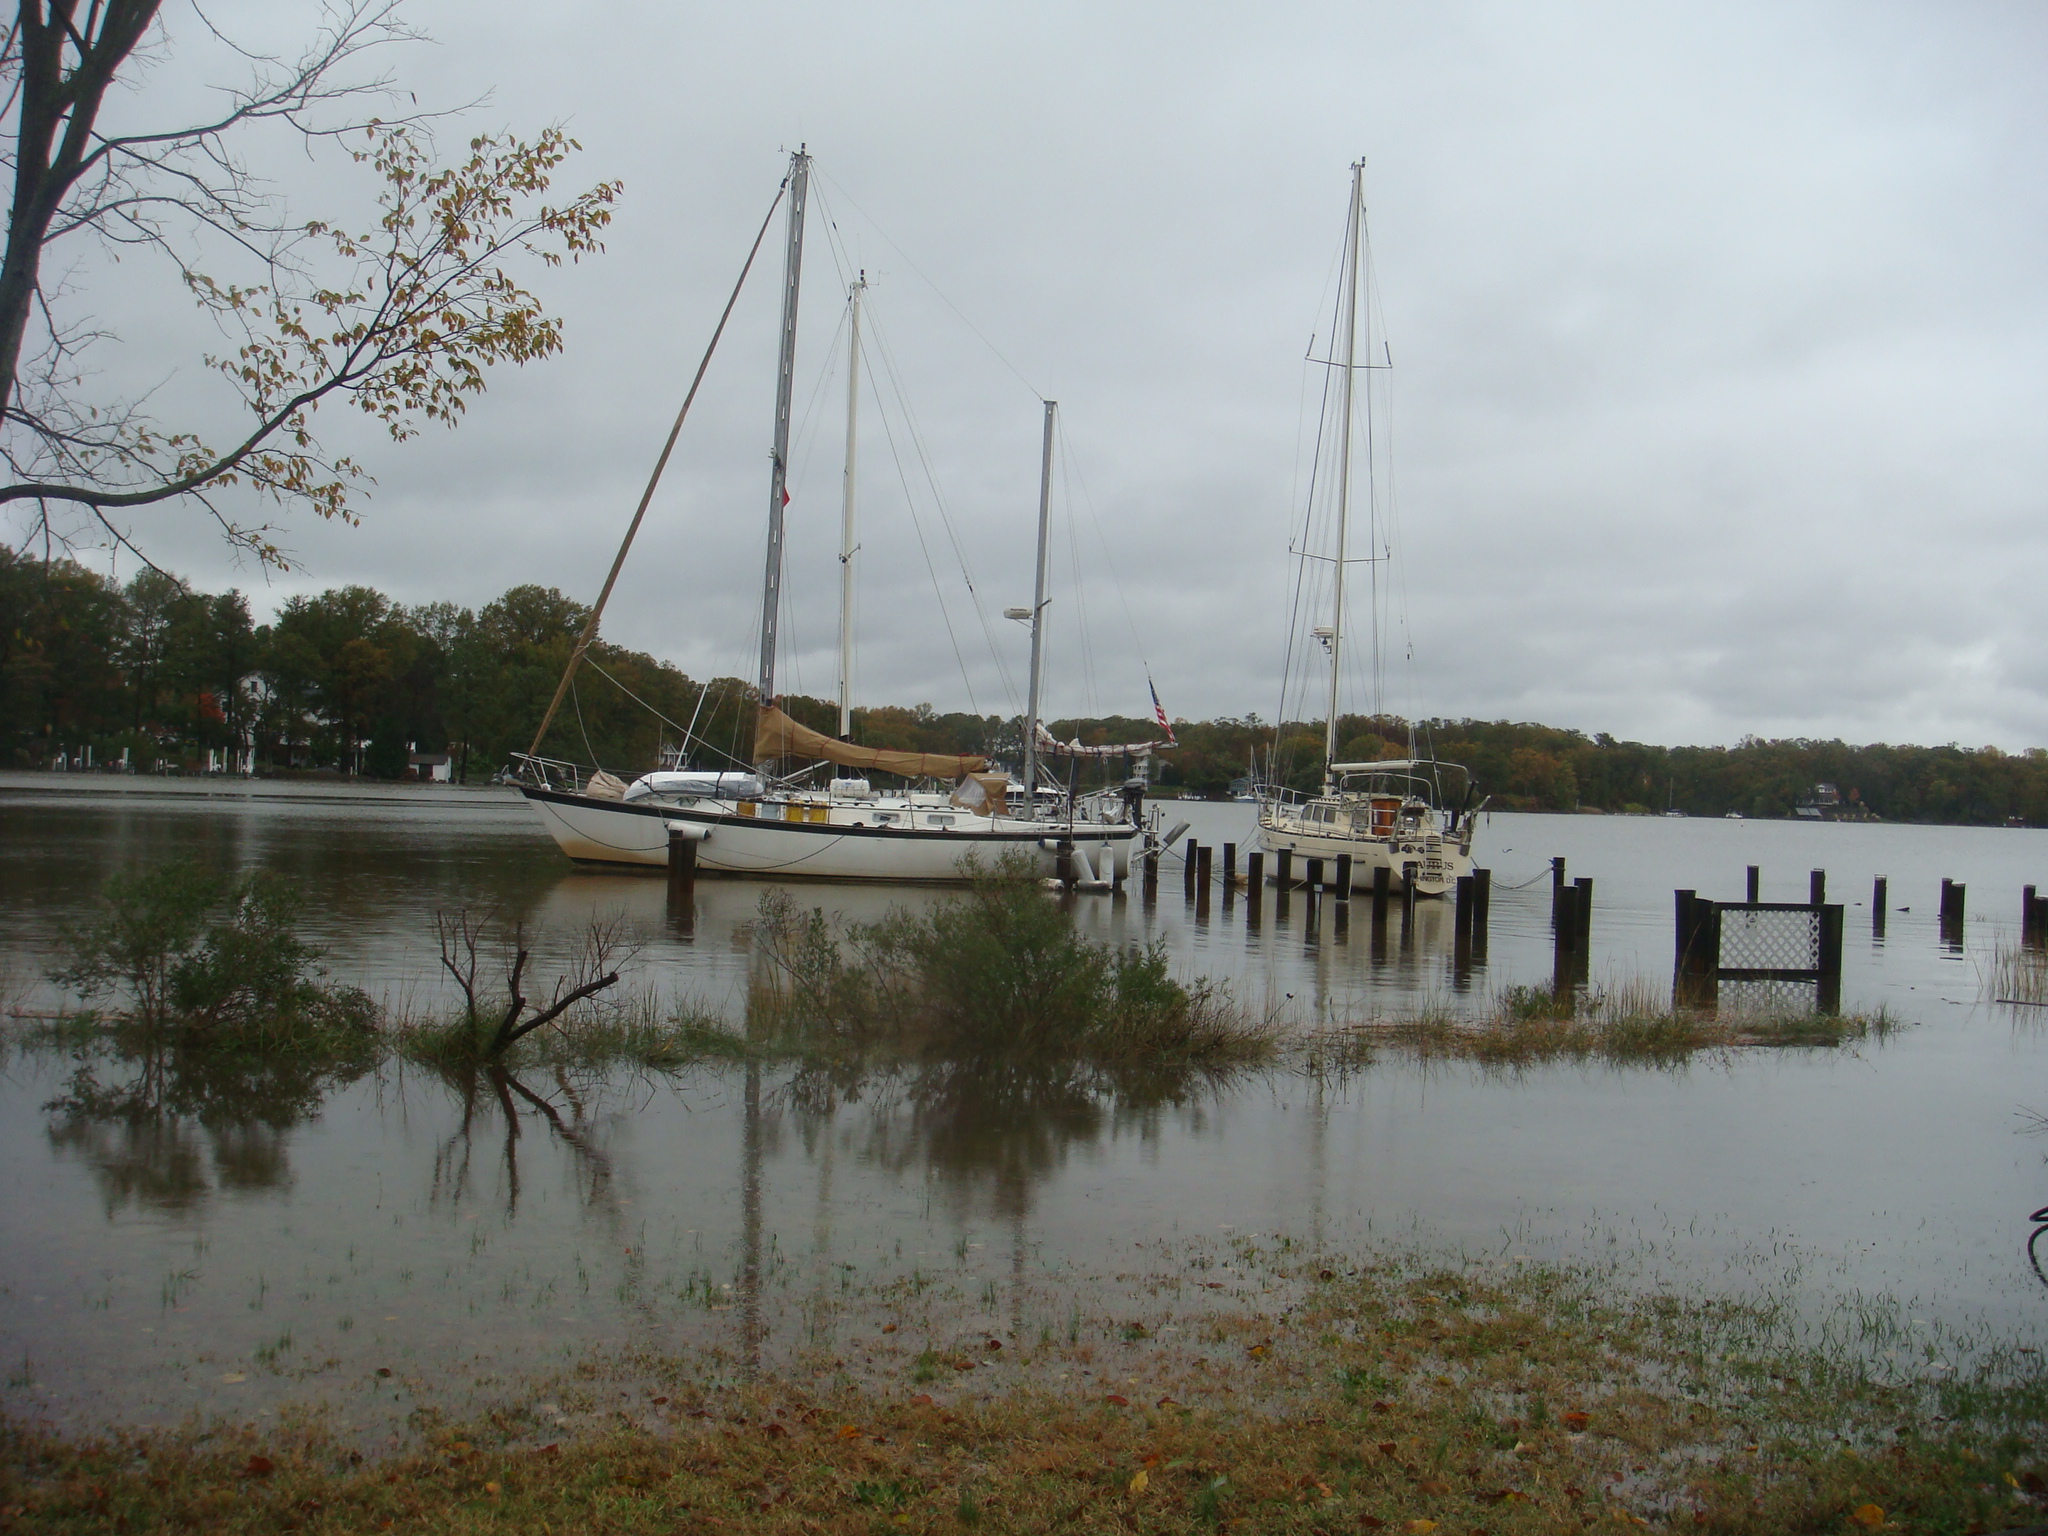 Cuckold Creek at High Tide Around Noon on Oct 30 |
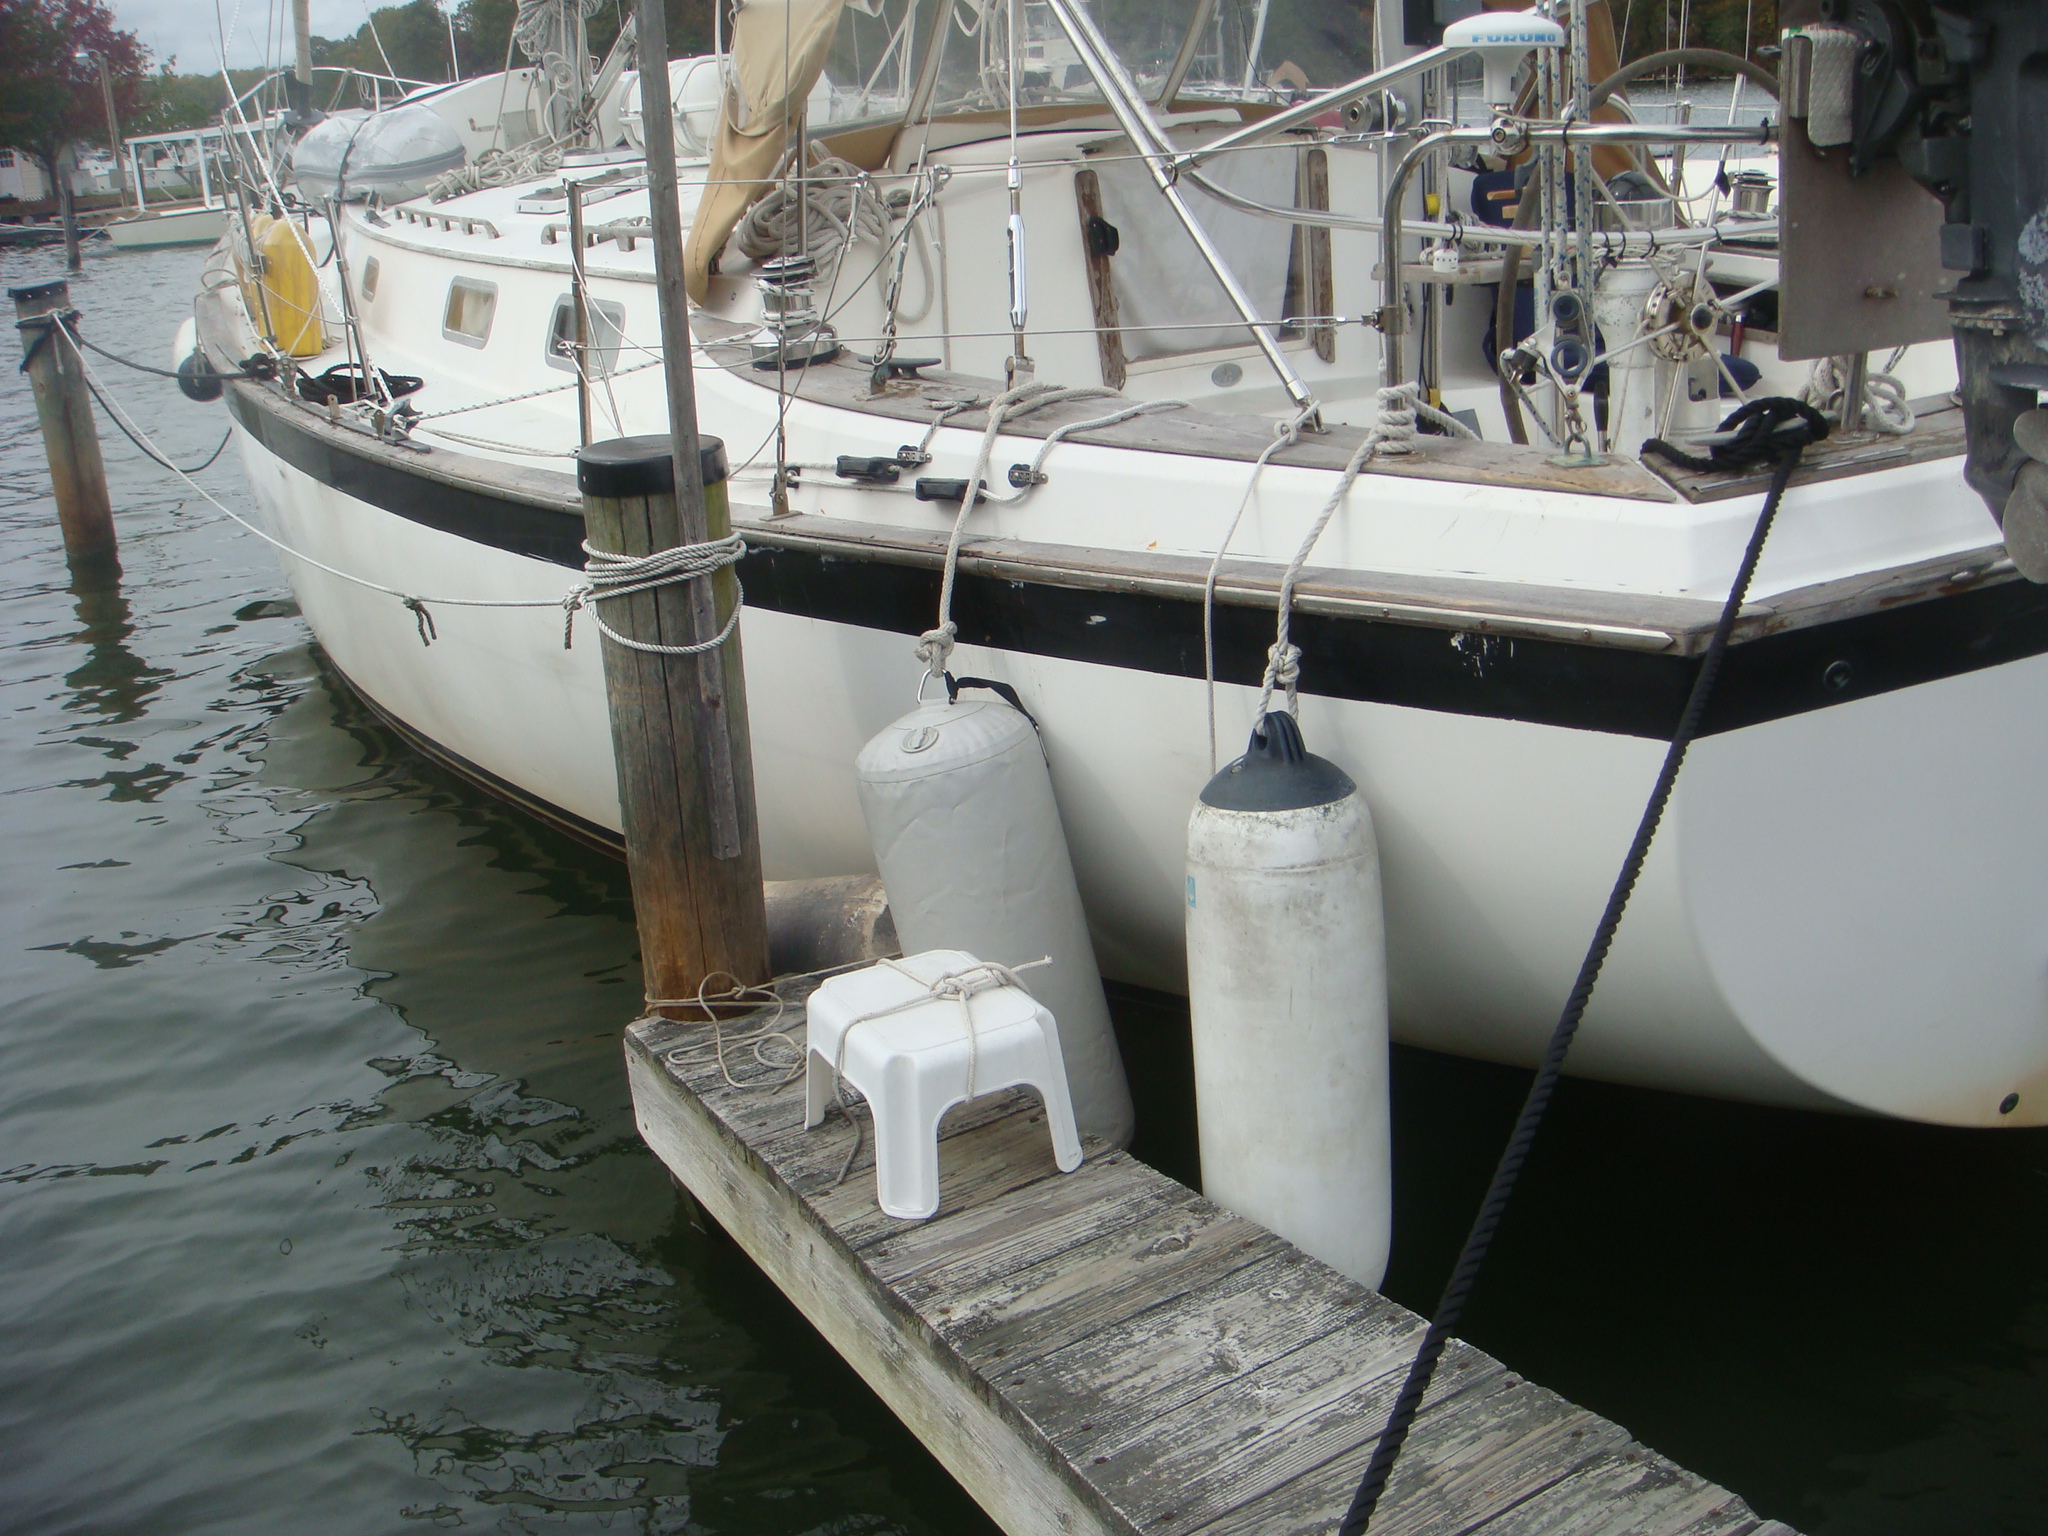
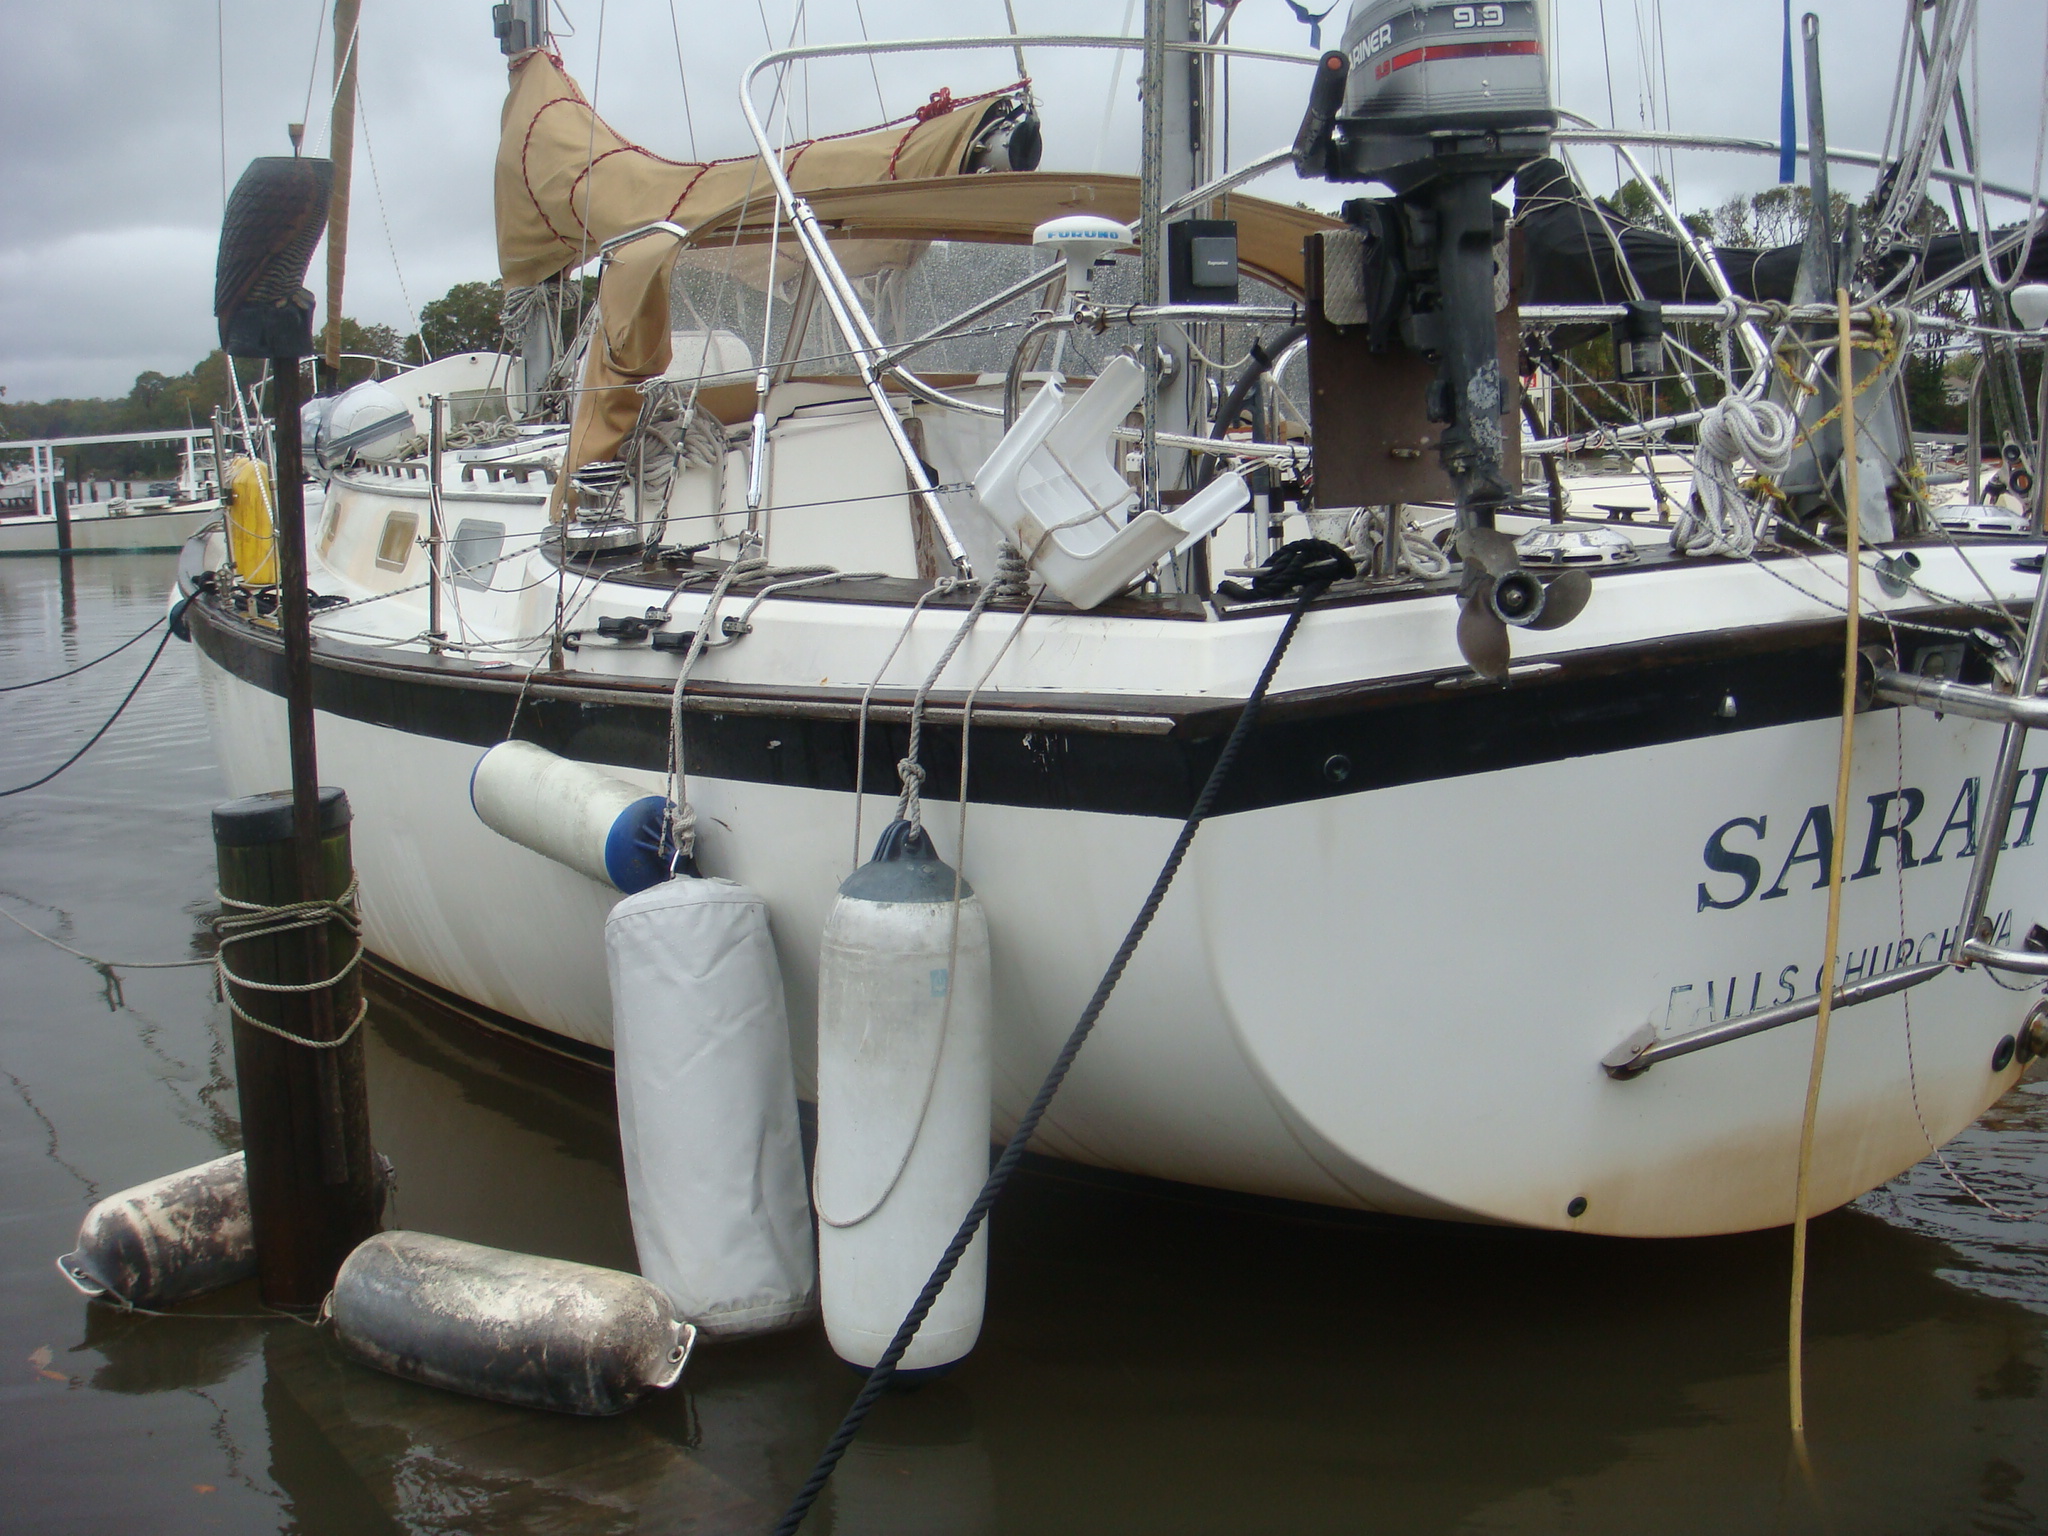 Water Too High to Get On Board |
I waded out to Sarah and realized that even with the stool
step I normally use at high tide it would be difficult to get on
board. I have a 3-step ladder in my car, but the finger
pier is too narrow to set it up. So I took a hotel room
for the night and waited for the water to recede. I had expected to see the water level only moderately above normal. Based on the wind data for Cove Pt. shown above, it appears the winds were more southerly than I realized and this pushed water up the Bay. That with the massive amount of rainfall running into the Bay and the surge on the Delaware Bay coming through the C&D Canal must have pushed to water to this level. |
| I returned to the dock the next day around the time of low
tide. The water level was still up, but now less than 1'
above normal. I turned on the dock electrical power and moved back on board Sarah. Now I've got to get Sarah ready to head south for the Winter. |
 Cuckold Creek at Low Tide on the Morning of Oct 31 |